


1. echarts的使用
安装
npm i -S echarts@4.9.0
引入
main.js中引入(版本4.9.0)
import Echarts from 'echarts'
Vue.prototype.$echarts = Echarts
使用
①绘制面积图
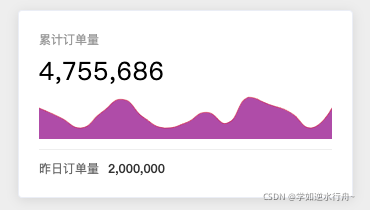
注意容器要有宽高,获取DOM都是在mounted中
<div id="total-orders-chart" :style="{ width: '100%', height: '100%'}"></div>
// 原生echarts
    const chartDom = document.getElementById('total-orders-chart')
    const chart = this.$echarts.init(chartDom)
    chart.setOption({
      xAxis: {
        type: 'category', // 默认是value,绘制出来是直线
        show: false,
        boundaryGap: false // 边界空白间隙
      }, // x轴
      yAxis: {
        show: false
      }, // y轴
      // 一个series就是一个图表
      series: [
        {
          type: 'line',
          data: [620, 432, 220, 534, 790, 430, 220, 320, 532, 320, 834, 690, 530, 220, 620],
          areaStyle: {
            color: 'purple' // 面积部分的颜色
          },
          lineStyle: {
            width: 0.5 // 线条
          },
          itemStyle: {
            opacity: 0 // 圆圈是否显示
          },
          smooth: true // 平滑
        }
      ],
      grid: { // 绘图网格的距离
        top: 0,
        left: 0,
        right: 0,
        bottom: 0
      }
    })
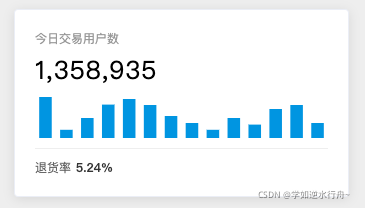
②绘制柱状图
<div
   id="today-users-chart"
   :style="{ width: '100%', height: '100%' }"
 ></div>
const chartDom = document.getElementById('today-users-chart')
    const chart = this.$echarts.init(chartDom)
    chart.setOption({
      color: '#3398db',
      tooltip: {},
      xAxis: {
        type: 'category',
        data:['00:00','01:00','02:00','03:00','04:00','05:00','06:00','07:00','08:00','09:00','10:00', '12:00','13:00', '14:00'],
        show: false
        // boundaryGap: false
      }, // x轴
      yAxis: {
        show: false
      }, // y轴
      // 一个series就是一个图表
      series: [
        {
          type: 'bar',
          data: [410, 82, 200, 334, 390, 330, 220, 150, 82, 200, 134, 290, 330, 150],
          barWidth: '60%',
          // areaStyle: {
          //   color: 'purple'
          // },
          // lineStyle: {
          //   width: 0
          // },
          // itemStyle: {
          //   opacity: 0
          // },
          // smooth: true
        }
      ],
      grid: {
        top: 0,
        left: 0,
        right: 0,
        bottom: 0
      }
    })
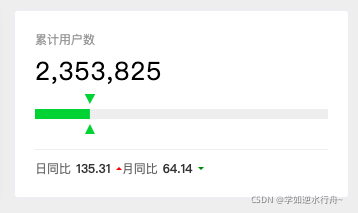
③绘制横向柱状图+自定义
<div
  id="total-users-chart"
  :style="{ width: '100%', height: '100%' }"
></div>
// 原生echarts
    const chartDom = document.getElementById('total-users-chart')
    const chart = this.$echarts.init(chartDom)
    chart.setOption({
      grid: {
        top: 0,
        left: 0,
        right: '-50%',
        bottom: 0
      },
      xAxis: {
        type: 'value',
        show: false,
        boundaryGap: false
      }, // x轴
      yAxis: {
        show: false,
        type: 'category'
      }, // y轴
      // 一个series就是一个图表
      series: [
        {
          type: 'bar',
          stack: '总量', // 添加这个属性可以让多个成为一行
          data: [100],
          barWidth: 10,
          itemStyle: {
            color: '#45c946'
          }
        },
        {
          type: 'bar',
          stack: '总量', // 添加这个属性可以让多个成为一行
          data: [750],
          itemStyle: {
            color: '#eee'
          }
        },
        {
          type: 'custom',
          stack: '总量', // 添加这个属性可以让多个成为一行
          data: [100], // 这里的100和series中的第一保持一致
          renderItem: (params, api) => {
            const value = api.value(0) // 会获取本对象(type=custom)中data的第一个元素100,
            const endPoint = api.coord([value, 0]) // 获取第一个元素(100)的坐标,数组中传入的参数是value的x轴和y轴的值,x轴值是100,y轴值是0
            console.log(8585, endPoint)
            return {
              type: 'group',
              position: endPoint, // 绘图的坐标系
              children: [
                {
                  type: 'path',
                  shape: {
                    d:
                      'M524.096 753.088l342.912-395.584a16 16 0 0 0-12.032-26.496H169.024a16 16 0 0 0-12.032 26.496l343.04 395.52a16 16 0 0 0 24.064 0z', // svg图像内容(iconfont中选好图片,点下载,弹窗中选复制svg,复制出来以后把path标签里面的d属性的值粘贴过来)
                    x: -5, // 偏移量
                    y: -20,
                    width: 10,
                    height: 10,
                    layout: 'cover' // SVGd的缩放属性
                  },
                  style: {
                    fill: '#45c946' // 填充色
                  }
                },
                {
                  type: 'path',
                  shape: {
                    d:
                      'M511.744 319.999l-383.744 383.744h767.488l-383.744-383.744z', // svg图像内容
                    x: -5, // 偏移量
                    y: 10,
                    width: 10,
                    height: 10,
                    layout: 'cover'
                  },
                  style: {
                    fill: '#45c946'
                  }
                }
              ]
            }
          }
        }
      ]
    })
④水球图
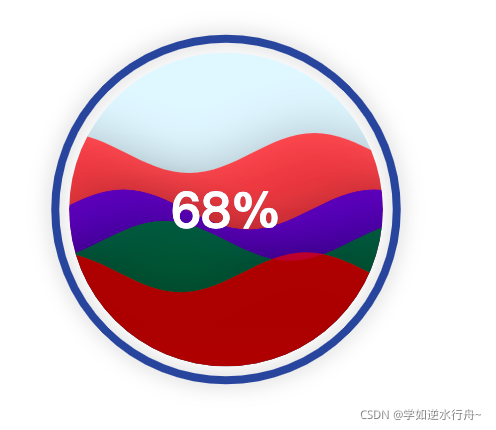
需要再安装 npm i -S echarts-liquidfill
<template>
  <div class="li-quid-fill" id="container">
  </div>
</template>
import 'echarts-liquidfill'

export default {
  name: 'liQuidFill',
  data () {
    return {}
  },
  created () {},
  mounted () {
    const data = [0.68, { value: 0.5, direction: 'left' }, 0.4, 0.3] // 波浪必须从小到大
    const chart = this.$echarts.init(document.getElementById('container'))
    chart.setOption({
      series: [
        {
          type: 'liquidFill',
          data,
          shape: 'circle', // 形状
          color: ['red', 'blue', 'green'],
          itemStyle: {
            opacity: 0.6
          },
          emphasis: {
            itemStyle: {
              opacity: 0.9
            }
          },
          // waveAnimation: false
          amplitude: 20, // 波浪振幅,数值越大,波浪越大
          backgroundStyle: {
            // color: 'purple',
            // borderWidth: 4,
            // borderColor: '#333'
          },
          outline: {
            show: true,
            borderDistance: 10,
            itemStyle: {
              // borderWidth: 2
              // borderColor: 'red'
              // shadowBlur: 'none'
            }
          }
        }
      ]
    })
  },
  methods: {}
}
</script>

<style lang="scss" scoped>
.li-quid-fill {
  height: 100%;
}
</style>
⑤词云图
需要再安装 npm i -S echarts-wordcloud
<div class="word-cloud" id="wordCloud"></div>
const data = [
      {
        name: '刘强东',
        value: 200
      },
      {
        name: '马云',
        value: 80
      },
      {
        name: '马超',
        value: 35
      },
      {
        name: '刘强东',
        value: 150
      },
      {
        name: '马云',
        value: 80
      },
      {
        name: '马超',
        value: 35
      },
      {
        name: '刘强东',
        value: 60
      },
      {
        name: '马云',
        value: 40
      },
      {
        name: '马超',
        value: 15
      }
    ]
    const chart = this.$echarts.init(document.getElementById('wordCloud'))
    chart.setOption({
      series: [
        {
          type: 'wordCloud',
          data,
          shape: 'circle', // 形状
          textStyle: {
            fontFamily: 'sans-serif',
            fontWeight: 'bold',
            // Color can be a callback function or a color string
            color: function() {
              // Random color
              return (
                'rgb(' +
                [
                  Math.round(Math.random() * 160),
                  Math.round(Math.random() * 160),
                  Math.round(Math.random() * 160)
                ].join(',') +
                ')'
              )
            }
          }
        }
      ]
    })
2. vue-echarts
安装
npm i -S echarts@4.9.0 vue-echarts@5.0.0-beta.0
引入 main.js
import Echarts from 'echarts'
import VueEcharts from 'vue-echarts'

Vue.prototype.$echarts = Echarts
Vue.component('v-chart', VueEcharts)
使用
①绘制面积图
组件默认宽高:600px×400px,如果需要我们可以手动设置
.echarts { width: 100%; height: 100%; },这个类(.echarts)组件自己的,v-chart外层不需要容器
<template>
	<v-chart :options="getOptions()" />
</template>
getOptions () {
      return {
        xAxis: {
          type: 'category',
          show: false,
          boundaryGap: false
        }, // x轴
        yAxis: {
          show: false
        }, // y轴
        // 一个series就是一个图表
        series: [
          {
            type: 'line',
            data: [620, 432, 220, 534, 790, 430, 220, 320, 532, 320, 834, 690, 530, 220, 620],
            // data: this.orderTrend,
            areaStyle: {
              color: 'purple'
            },
            lineStyle: {
              width: 0
            },
            itemStyle: {
              opacity: 0
            },
            smooth: true
          }
        ],
        grid: {
          top: 0,
          left: 0,
          right: 0,
          bottom: 0
        }
      }
    }
②绘制柱状图
<v-chart :options="getOptions()" />
getOptions () {
      return {
        color: '#3398db',
        tooltip: {},
        xAxis: {
          type: 'category',
          // data: this.orderUserTrendAxis,
          data: [
            '00:00','01:00','02:00','03:00','04:00','05:00','06:00','07:00','08:00','09:00','10:00','12:00','13:00','14:00'
          ],
          show: false
          // boundaryGap: false
        }, // x轴
        yAxis: {
          show: false
        }, // y轴
        // 一个series就是一个图表
        series: [
          {
            type: 'bar',
            // data: this.orderUserTrend,
            data: [
              410,82,200,334,390,330,220,150,82,200,134,290,330,150
            ],
            barWidth: '60%'
            // areaStyle: {
            //   color: 'purple'
            // },
            // lineStyle: {
            //   width: 0
            // },
            // itemStyle: {
            //   opacity: 0
            // },
            // smooth: true
          }
        ],
        grid: {
          top: 0,
          left: 0,
          right: 0,
          bottom: 0
        }
      }
    }
③绘制横向柱状图+自定义
<v-chart :options="getOptions()" />
getOptions () {
      return {
        grid: {
          top: 0,
          left: 0,
          right: '-50%',
          bottom: 0
        },
        xAxis: {
          type: 'value',
          show: false,
          boundaryGap: false
        }, // x轴
        yAxis: {
          show: false,
          type: 'category'
        }, // y轴
        // 一个series就是一个图表
        series: [
          {
            name: '上月平台用户数',
            type: 'bar',
            stack: '总量', // 添加这个属性可以让多个成为一行
            data: [100],
            // data: [this.userLastMonth],
            barWidth: 10,
            itemStyle: {
              color: '#45c946'
            }
          },
          {
            name: '今日平台用户数',
            type: 'bar',
            stack: '总量', // 添加这个属性可以让多个成为一行
            // data: [this.userTodayNumber],
            data: [750],
            itemStyle: {
              color: '#eee'
            }
          },
          {
            type: 'custom',
            stack: '总量', // 添加这个属性可以让多个成为一行
            data: [100], // 这里的100和series中的第一个保持一致
            // data: [this.userLastMonth], // 这里的100和series中的第一个保持一致
            renderItem: (params, api) => {
              const value = api.value(0) // 会获取本对象中data的第一个 200,
              const endPoint = api.coord([value, 0]) // 获取2第一个元素(200)的坐标
              console.log(8585, endPoint)
              return {
                type: 'group',
                position: endPoint,
                children: [
                  {
                    type: 'path',
                    shape: {
                      d:
                        'M524.096 753.088l342.912-395.584a16 16 0 0 0-12.032-26.496H169.024a16 16 0 0 0-12.032 26.496l343.04 395.52a16 16 0 0 0 24.064 0z', // svg图像内容
                      x: -5, // 偏移量
                      y: -20,
                      width: 10,
                      height: 10,
                      layout: 'cover'
                    },
                    style: {
                      fill: '#45c946'
                    }
                  },
                  {
                    type: 'path',
                    shape: {
                      d:
                        'M511.744 319.999l-383.744 383.744h767.488l-383.744-383.744z', // svg图像内容
                      x: -5, // 偏移量
                      y: 10,
                      width: 10,
                      height: 10,
                      layout: 'cover'
                    },
                    style: {
                      fill: '#45c946'
                    }
                  }
                ]
              }
            }
          }
        ]
      }
    }
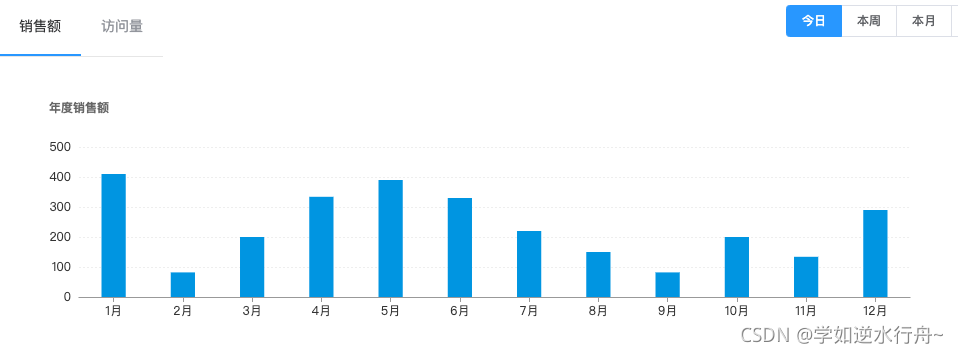
④ 绘制柱状图
<v-chart :options="chartOption" />
// 轴上的刻度
            alignWithLabel: true,
            lineStyle: {
              color: '#999'
            }
          },
          axisLine: { // 轴线
            lineStyle: {
              color: '#f00'
            }
          },
          axisLabel: {
            color: '#0f0'
          }
        },
        yAxis: {
          axisLine: { // 轴线
            show: false
          },
          axisTick: { // 轴上的刻度
            show: false
          },
          splitLine: { // 网格分割线
            lineStyle: {
              type: 'dotted',
              color: '#eee'
            }
          }
        },
        series: [
          {
            type: 'bar',
            barWidth: '35%',
            data: [200, 250, 300, 350, 300, 250, 200, 250, 300, 350, 300, 250]
          }
        ],
        color: '#3398db', // 柱子颜色
        grid: {
          top: 70,
          left: 60,
          right: 60,
          bottom: 50
        }
      }
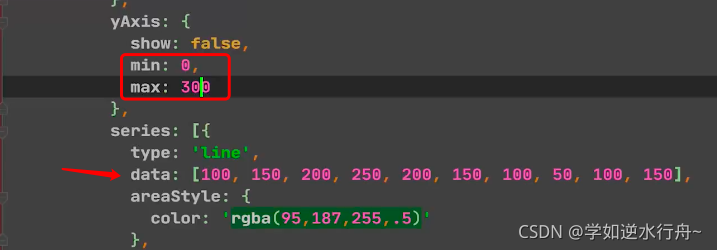
插曲 面积图时,如果Y轴上方顶边了,可设置min, max
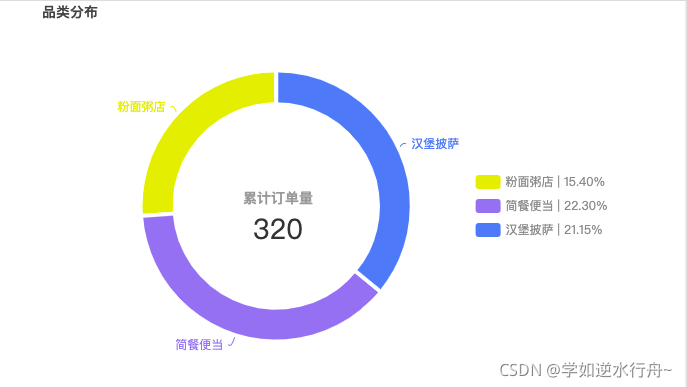
⑤环形饼状图
<v-chart :options="categoryOptions" />
renderPieChart () {
      const mockData = [
        {
          legengName: '粉面粥店',
          value: 67,
          percent: '15.40',
          itemStyle: {
            color: '#e7e702'
          },
          name: '粉面粥店 | 15.40%'
        },
        {
          legengName: '简餐便当',
          value: 97,
          percent: '22.30',
          itemStyle: {
            color: '#8d7fec'
          },
          name: '简餐便当 | 22.30%'
        },
        {
          legengName: '汉堡披萨',
          value: 92,
          percent: '21.15',
          itemStyle: {
            color: '#5085f2'
          },
          name: '汉堡披萨 | 21.15%'
        }
      ]
      console.log(mockData, colors)
      this.categoryOptions = {
        title: [
          {
            text: '品类分布', // 两个标题
            textStyle: {
              fontSize: 14,
              color: '#444'
            },
            left: 20,
            top: 20
          },
          {
            text: '累计订单量', // 两个标题
            subtext: 320, // 副标题
            x: '39.5%',
            y: '45.5%',
            textStyle: {
              fontSize: 14,
              color: '#999'
            },
            subtextStyle: {
              fontSize: 28,
              color: '#333'
            },
            textAlign: 'center'
            // left: 20,
            // top: 20
          }
        ],
        series: [
          {
            name: '品类分布',
            type: 'pie',
            data: mockData,
            label: {
              // normal: {
              show: true,
              // position: 'outter',
              formatter (params) {
                return params.data.legengName
              }
              // }
            },
            center: ['40%', '50%'], // 饼图位置
            radius: ['45%', '60%'], // radius 半径:第一个值是内半径、第二个值是外半径
            labelLine: {
              // normal: {
              length: 5, // 指向饼图的长线段
              length2: 3, // 指向文字的线段
              smooth: true
              // }
            },
            clockwise: false, // 数据是否顺时针
            itemStyle: { // 每个图之间的间隙
              borderWidth: 4,
              borderColor: '#fff'
            }
          }
        ],
        legend: { // 品类的描述
          type: 'scroll',
          orient: 'vertical',
          height: 250,
          top: 'middle',
          left: '70%',
          textStyle: {
            color: '#8c8c8c'
          }
        },
        tooltip: {
          trigger: 'item',
          formatter (params) {
            const str =
              params.seriesName +
              '<br/>' +
              params.marker +
              params.data.legengName +
              '<br/>' +
              '数量:' +
              params.data.value +
              '<br/>' +
              '占比:' +
              params.data.percent +
              '%'
            return str
          },
          backgroundColor: 'rgba(50, 50, 50, 0.7)',
          textStyle: {
            color: '#fff'
          }
        }
      }
    },
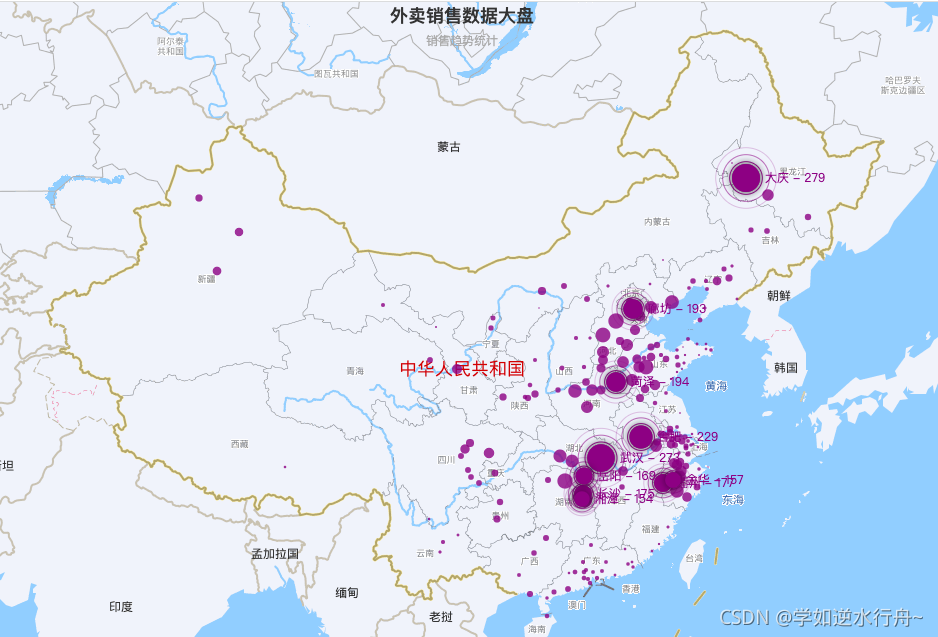
⑥绘制百度地图散点图
要在index.html中引入百度地图api
<script type="text/javascript" src="http://api.map.baidu.com/api?v=2.0&ak=G1LFyjrNGIkns5OfpZnrCGAKxpycPLwb"></script>
然后bMap.vue文件中引入 echarts/extension/bmap/bmap
<template>
  <div class="b-map-test">
    <v-chart :options="option"></v-chart>
  </div>
</template>
// 第二步要引入这里
import 'echarts/extension/bmap/bmap'

this.option = {
      title: {
        text: '外卖销售数据大盘',
        subtext: '销售趋势统计',
        sublink: 'https://www.baidu.com',
        left: 'center'
      },
      bmap: {
        key: 'G1LFyjrNGIkns5OfpZnrCGAKxpycPLwb',
        center: [104.114129, 37.550339],
        zoom: 5, // 缩放比例
        roam: true, // 是否允许鼠标交互如缩放、拖拽
        mapStyle: {
          styleJson: [
            {
              featureType: 'water',
              elementType: 'all',
              stylers: {
                color: '#d1d1d1'
              }
            },
            {
              featureType: 'land',
              elementType: 'all',
              stylers: {
                color: '#f3f3f3'
              }
            },
            {
              featureType: 'railway',
              elementType: 'all',
              stylers: {
                visibility: 'off'
              }
            },
            {
              featureType: 'highway',
              elementType: 'all',
              stylers: {
                color: '#fdfdfd'
              }
            },
            {
              featureType: 'highway',
              elementType: 'labels',
              stylers: {
                visibility: 'off'
              }
            },
            {
              featureType: 'arterial',
              elementType: 'geometry',
              stylers: {
                color: '#fefefe'
              }
            },
            {
              featureType: 'arterial',
              elementType: 'geometry.fill',
              stylers: {
                color: '#fefefe'
              }
            },
            {
              featureType: 'poi',
              elementType: 'all',
              stylers: {
                visibility: 'off'
              }
            },
            {
              featureType: 'green',
              elementType: 'all',
              stylers: {
                visibility: 'off'
              }
            },
            {
              featureType: 'subway',
              elementType: 'all',
              stylers: {
                visibility: 'off'
              }
            },
            {
              featureType: 'manmade',
              elementType: 'all',
              stylers: {
                color: '#d1d1d1'
              }
            },
            {
              featureType: 'local',
              elementType: 'all',
              stylers: {
                color: '#d1d1d1'
              }
            },
            {
              featureType: 'arterial',
              elementType: 'labels',
              stylers: {
                visibility: 'off'
              }
            },
            {
              featureType: 'boundary',
              elementType: 'all',
              stylers: {
                color: '#fefefe'
              }
            },
            {
              featureType: 'building',
              elementType: 'all',
              stylers: {
                color: '#d1d1d1'
              }
            },
            {
              featureType: 'label',
              elementType: 'labels.text.fill',
              stylers: {
                color: '#999999'
              }
            }
          ]
        }
      },
      tooltip: {},
      series: [
        {
          name: '销售额',
          type: 'scatter', // 散点图
          coordinateSystem: 'bmap', // 坐标系统 百度地图
          data: convertData(data),
          encode: {
            value: 2 // 定制value值为数据value数组中的第三项,下标为2,效果:tooltip上显示的就是销售额数值80、100、180(因为经过convertData函数处理后,数据变成了 { name: '海门', value: [ x坐标, y坐标, 180] })
          },
          itemStyle: {
            color: 'purple' // 点的颜色
          },
          symbolSize (value) { // 点的大小
            return value[2] / 10 // 这里的value为每个数据的value数组,取第三项,缩小10倍
          },
          label: {
            show: false, // 这里设置成false,配合下面的emphasis,效果是鼠标移入显示label
            position: 'right',
            // formatter: '{b}' // 默认为value值
            formatter (v) {
              return `${v.data.name} - ${v.data.value[2]}`
            }
          },
          emphasis: {
            label: {
              show: true
            }
          }
        },
        {
          name: 'Top 10',
          type: 'effectScatter',
          coordinateSystem: 'bmap',
          data: convertData(data.sort((a, b) => b.value - a.value)).slice(0, 10),
          encode: {
            value: 2
          },
          symbolSize (value) { // 点的大小
            return value[2] / 10 // 这里的value为每个数据的value数组,取第三项,缩小10倍
          },
          label: {
            show: true,
            position: 'right',
            // formatter: '{b}'
            formatter (v) {
              return `${v.data.name} - ${v.data.value[2]}`
            }
          },
          hoverAnimation: true,
          rippleEffect: { // 波纹效果
            brushType: 'stroke'
          },
          itemStyle: {
            color: 'purple',
            shadowBlur: 10,
            shadowColor: '#333'
          }
        }
      ]
    }
3. v-echarts
安装
npm i -S v-charts@1.19.0 echarts@4.9.0
引入 main.js
import './plugins/vcharts'
plugins/vcharts.js
import Vue from 'vue'
// 支持按需引入
// import VEline from 'v-charts/lib/line.common'
// Vue.component('ve-line', VEline)

import VCharts from 'v-charts'
import 'v-charts/lib/style.css'

Vue.use(VCharts)
①绘制百度地图散点图
<template>
    <!-- v-charts的地图功能 -->
    <!-- <ve-map :data="chartData" height="800px"></ve-map> -->

    <!-- 另外 v-charts还封装了百度地图、高德地图的壳子, 使用了v-bmap之后就不用在index.html中引入百度地图的api了 -->
    <ve-bmap
    :title="title"
    :settings="chartSettings"
    :tooltip="{}"
    :series="chartSeries"
    height="100%">
  </ve-bmap>
</template>
title: {
        text: '外卖销售数据大盘',
        subtext: '销售趋势统计',
        sublink: 'https://www.baidu.com',
        left: 'center'
      },
      chartSettings: {
        key: 'G1LFyjrNGIkns5OfpZnrCGAKxpycPLwb',
        bmap: {
          center: [104.114129, 37.550339],
          zoom: 5,
          roam: false,
          mapStyle: {
            styleJson: [
              {
                featureType: 'water',
                elementType: 'all',
                stylers: {
                  color: '#d1d1d1'
                }
              },
              {
                featureType: 'land',
                elementType: 'all',
                stylers: {
                  color: '#f3f3f3'
                }
              },
              {
                featureType: 'railway',
                elementType: 'all',
                stylers: {
                  visibility: 'off'
                }
              },
              {
                featureType: 'highway',
                elementType: 'all',
                stylers: {
                  color: '#fdfdfd'
                }
              },
              {
                featureType: 'highway',
                elementType: 'labels',
                stylers: {
                  visibility: 'off'
                }
              },
              {
                featureType: 'arterial',
                elementType: 'geometry',
                stylers: {
                  color: '#fefefe'
                }
              },
              {
                featureType: 'arterial',
                elementType: 'geometry.fill',
                stylers: {
                  color: '#fefefe'
                }
              },
              {
                featureType: 'poi',
                elementType: 'all',
                stylers: {
                  visibility: 'off'
                }
              },
              {
                featureType: 'green',
                elementType: 'all',
                stylers: {
                  visibility: 'off'
                }
              },
              {
                featureType: 'subway',
                elementType: 'all',
                stylers: {
                  visibility: 'off'
                }
              },
              {
                featureType: 'manmade',
                elementType: 'all',
                stylers: {
                  color: '#d1d1d1'
                }
              },
              {
                featureType: 'local',
                elementType: 'all',
                stylers: {
                  color: '#d1d1d1'
                }
              },
              {
                featureType: 'arterial',
                elementType: 'labels',
                stylers: {
                  visibility: 'off'
                }
              },
              {
                featureType: 'boundary',
                elementType: 'all',
                stylers: {
                  color: '#fefefe'
                }
              },
              {
                featureType: 'building',
                elementType: 'all',
                stylers: {
                  color: '#d1d1d1'
                }
              },
              {
                featureType: 'label',
                elementType: 'labels.text.fill',
                stylers: {
                  color: '#999999'
                }
              }
            ]
          }
        }
      },
      chartSeries: [
        {
          name: '销售额',
          type: 'scatter', // 散点图
          coordinateSystem: 'bmap', // 坐标系统 百度地图
          data: convertData(data),
          encode: {
            value: 2 // 定制value值为数据value数组中的第三项,下标为2,效果:tooltip上显示的就是销售额数值80、100、120
          },
          itemStyle: {
            color: 'purple' // 点的颜色
          },
          symbolSize (value) { // 点的大小
            return value[2] / 10 // 这里的value为每个数据的value数组,取第三项,缩小10倍
          },
          label: {
            show: false, // 这里设置成false,配合下面的emphasis,效果是鼠标移入显示label
            position: 'right',
            // formatter: '{b}' // 默认为value值
            formatter (v) {
              return `${v.data.name} - ${v.data.value[2]}`
            }
          },
          emphasis: {
            label: {
              show: true
            }
          }
        },
        {
          name: 'Top 10',
          type: 'effectScatter',
          coordinateSystem: 'bmap',
          data: convertData(data.sort((a, b) => b.value - a.value)).slice(0, 10),
          encode: {
            value: 2
          },
          symbolSize (value) { // 点的大小
            return value[2] / 10 // 这里的value为每个数据的value数组,取第三项,缩小10倍
          },
          label: {
            show: true,
            position: 'right',
            // formatter: '{b}'
            formatter (v) {
              return `${v.data.name} - ${v.data.value[2]}`
            }
          },
          hoverAnimation: true,
          rippleEffect: { // 波纹效果
            brushType: 'stroke'
          },
          itemStyle: {
            color: 'purple',
            shadowBlur: 10,
            shadowColor: '#333'
          }
        }
      ]
② 水球图
v-charts自己提供的
<ve-liquidfill :data="chartData" height="100%" :settings="chartSettings" />
function getColor(value) {
  // return 'rgba(97,216,0,.7)' // 0-0.5绿
  // return 'rgba(204,178,26,.7)' // 0.5-0.8土黄
  // return 'rgba(241,47,28,.7)'  //0.8+ 红
  // return '#c7c7cb' // 灰
  return value > 0 && value <= 0.5
    ? 'rgba(97,216,0,.7)'
    : value > 0.5 && value <= 0.8
    ? 'rgba(204,178,26,.7)'
    : value > 0.8
    ? 'rgba(241,47,28,.7)'
    : '#c7c7cb'
}
chartData: {
         columns: ['title', 'percent'],
         rows: [{ title: 'rate', percent: 0.4825 }]
      },
chartSettings = {
      seriesMap: {
        rate: {
          radius: '80%',
          label: {
            // 这里不要formatter 显示的值就是48%
            formatter(value) {
              return `${Math.floor(value.data.value * 100)}%`
            },
            textStyle: {
              fontSize: 36,
              color: '#999',
              fontWeight: 'normal'
            },
            position: ['50%', '50%'], // label的默认位置就是这个,居中的
            insideColor: '#fff' // 水波纹和数字重叠时的颜色
          },
          outline: {
            itemStyle: {
              borderColor: '#aaa4a4',
              borderWidth: 1,
              color: 'none', // 环状空白的颜色
              shadowBlur: 0,
              shadowColor: '#fff'
            },
            borderDistance: 0
          },
          backgroundStyle: {
            color: '#fff'
          },
          itemStyle: {
            shadowBlur: 0, // 水波纹的阴影
            shadowColor: '#fff'
          },
          amplitude: 8, // 水波浪的振幅
          color: [getColor(this.chartData.rows[0].percent)]
        }
      }
    }
③词云图
 <ve-wordcloud
      :data="chartData"
      :settings="chartSettings"
      height="100%"
 ></ve-wordcloud>
chartData: {
        columns: ['name', 'value'],
        rows: [
          {
            name: '马超',
            value: 100 * Math.random()
          },
          {
            name: '马超1',
            value: 100 * Math.random()
          },
          {
            name: '马超2',
            value: 100 * Math.random()
          },
          {
            name: '马超3',
            value: 100 * Math.random()
          },
          {
            name: '马超4',
            value: 100 * Math.random()
          },
          {
            name: '马超5',
            value: 100 * Math.random()
          },
          {
            name: '马超6',
            value: 100 * Math.random()
          },
          {
            name: '马超7',
            value: 100 * Math.random()
          },
          {
            name: '马超8',
            value: 100 * Math.random()
          },
          {
            name: '马超9',
            value: 100 * Math.random()
          },
          {
            name: '马超10',
            value: 100 * Math.random()
          }
        ]
      },
      chartSettings: {
        color: [
          'rgba(97,216,0,.7)',
          'rgba(204,178,26,.7)',
          'rgba(245,166,35,.7)',
          'rgba(156,13,113,.7)'
        ]
      }


 310
310


 被折叠的 条评论
为什么被折叠?
被折叠的 条评论
为什么被折叠?
 到【灌水乐园】发言


