


安装Prometheus
-
下载Prometheus相关安装包 https://prometheus.io/download/
-
修改prometheus相关配置
# my global config global: scrape_interval: 15s # Set the scrape interval to every 15 seconds. Default is every 1 minute. evaluation_interval: 15s # Evaluate rules every 15 seconds. The default is every 1 minute. # scrape_timeout is set to the global default (10s). # Alertmanager configuration alerting: alertmanagers: - static_configs: - targets: # - alertmanager:9093 # Load rules once and periodically evaluate them according to the global 'evaluation_interval'. rule_files: # - "first_rules.yml" # - "second_rules.yml" # A scrape configuration containing exactly one endpoint to scrape: # Here it's Prometheus itself. scrape_configs: # The job name is added as a label `job=<job_name>` to any timeseries scraped from this config. - job_name: "prometheus" # metrics_path defaults to '/metrics' # scheme defaults to 'http'. static_configs: - targets: ["localhost:9090"] - job_name: 'spring-boot-actuator-exporter' # 指定抓取的路径 默认Spring Aactua暴露端点地址如下 metrics_path: '/actuator/prometheus' static_configs: # 配置需要监控的应用地址 - targets: ['localhost:8080','localhost:8081'] # 自定义标签 labels: nodename: 'spring-boot-actuator' -
启动prometheus
bash ./prometheus.sh -
查看prometheus WEB界面保证启动成功 http://localhost:9090
![[外链图片转存失败,源站可能有防盗链机制,建议将图片保存下来直接上传(img-H2oV7xFk-1655264375552)(https://gitee.com/jianimaoju/image-storage-service/raw/master/image/202206/15/110224-997938.png)]](https://img-blog.csdnimg.cn/87db43d8ea2243f39ec08242358c33f8.png)
搭建SpringBoot项目
-
创建SpringBoot应用
-
添加pom依赖
<dependencies> <dependency> <groupId>org.springframework.boot</groupId> <artifactId>spring-boot-starter-actuator</artifactId> </dependency> <dependency> <groupId>org.springframework.boot</groupId> <artifactId>spring-boot-starter-web</artifactId> </dependency> <dependency> <groupId>io.micrometer</groupId> <artifactId>micrometer-registry-prometheus</artifactId> <scope>runtime</scope> </dependency> </dependencies> -
修改application配置文件
spring: application: name: promethus_springboot management: endpoint: prometheus: enabled: true metrics: tags: application: ${spring.application.name} endpoints: web: exposure: include: prometheus # 暴露prometheus端点 -
查看端点信息是否正常 访问http://localhost:8080/actuator/prometheus
![[外链图片转存失败,源站可能有防盗链机制,建议将图片保存下来直接上传(img-pVMJVVpV-1655264375553)(https://gitee.com/jianimaoju/image-storage-service/raw/master/image/202206/15/105156-832585.png)]](https://img-blog.csdnimg.cn/407fecd363dd42fbac68aa3bae53431a.png)
Spring Boot自定义监控项
业务系统相关统计项一般用基于Spring Bean去实现,建议通过实现MeterBinder接口自动注册到Spring容器中
统计工具参考Meter框架中一些常用的统计工具 如Counter Gauge Timer等
@Component
public class MyMeterBinder implements MeterBinder {
    // 普通的Spring Service可用于业务系统自定义
    @Autowired
    private StatiscService statiscService;

    @Value("${spring.application.name}")
    private String applicationName;

    @Override
    public void bindTo(MeterRegistry meterRegistry) {
        Gauge.builder("MyGauge", () -> statiscService.statisticsTest())
                .baseUnit("ge")
                .description("测试我的prometheus gauge")
                .strongReference(true)
                .tag("application", applicationName)
                .register(meterRegistry);
    }
}
@Service
public class StatiscService {

    public Long statisticsTest() {
        long randomLong = ThreadLocalRandom.current().nextLong(500L);
        System.out.println(randomLong);
        return randomLong;
    }
}
通过端点正确性访问http://localhost:8080/actuator/prometheus
![[外链图片转存失败,源站可能有防盗链机制,建议将图片保存下来直接上传(img-6hUqSG3N-1655264375553)(https://gitee.com/jianimaoju/image-storage-service/raw/master/image/202206/15/112756-901437.png)]](https://img-blog.csdnimg.cn/5ea764b3e60841fabd1bb82ffc03af05.png)
prometheus上查询结果如下
![[外链图片转存失败,源站可能有防盗链机制,建议将图片保存下来直接上传(img-pzEklYdY-1655264375553)(https://gitee.com/jianimaoju/image-storage-service/raw/master/image/202206/15/112823-868888.png)]](https://img-blog.csdnimg.cn/386ad18983544a6480856fa13897cf7c.png)
安装grafana实现监控可视化
-
下载grafana https://grafana.com/get/?plcmt=top-nav&cta=downloads&tab=self-managed
-
启动grafana bash ./grafana-server.sh
-
登陆grafana http://localhost:3000/ admin/admin
![[外链图片转存失败,源站可能有防盗链机制,建议将图片保存下来直接上传(img-0JEfeT2Z-1655264375554)(https://gitee.com/jianimaoju/image-storage-service/raw/master/image/202206/15/113259-965382.png)]](https://img-blog.csdnimg.cn/cb53e75202f145e6a3729d659a51ccfc.png)
-
配置Datasource
![[外链图片转存失败,源站可能有防盗链机制,建议将图片保存下来直接上传(img-QF6ydbed-1655264375554)(https://gitee.com/jianimaoju/image-storage-service/raw/master/image/202206/15/113555-180186.png)]](https://img-blog.csdnimg.cn/cd890ab44d3e489884367b1cd49798a1.png)
![[外链图片转存失败,源站可能有防盗链机制,建议将图片保存下来直接上传(img-hah4230Z-1655264375554)(https://gitee.com/jianimaoju/image-storage-service/raw/master/image/202206/15/113627-709824.png)]](https://img-blog.csdnimg.cn/be643a1e7d1044f9a8bf1a44094637bd.png)
-
下载SpringBoot相关的Dashboard的json https://grafana.com/grafana/dashboards/
-
搜索需要的仪表盘 以SpringBoot为例
![[外链图片转存失败,源站可能有防盗链机制,建议将图片保存下来直接上传(img-0yj4Yu2b-1655264375554)(https://gitee.com/jianimaoju/image-storage-service/raw/master/image/202206/15/113420-18094.png)]](https://img-blog.csdnimg.cn/7a6fe2f4007a41ab9941e2b52416cb00.png)
-
下载Json
![[外链图片转存失败,源站可能有防盗链机制,建议将图片保存下来直接上传(img-FP4f4QZh-1655264375554)(https://gitee.com/jianimaoju/image-storage-service/raw/master/image/202206/15/113445-974982.png)]](https://img-blog.csdnimg.cn/9164b2227b63427f9287a8f637d5fdb7.png)
-
导入仪表盘
![[外链图片转存失败,源站可能有防盗链机制,建议将图片保存下来直接上传(img-vkOdQAF0-1655264375555)(https://gitee.com/jianimaoju/image-storage-service/raw/master/image/202206/15/113723-572783.png)]](https://img-blog.csdnimg.cn/0f52fc77b996480d82697388d096c854.png)
-
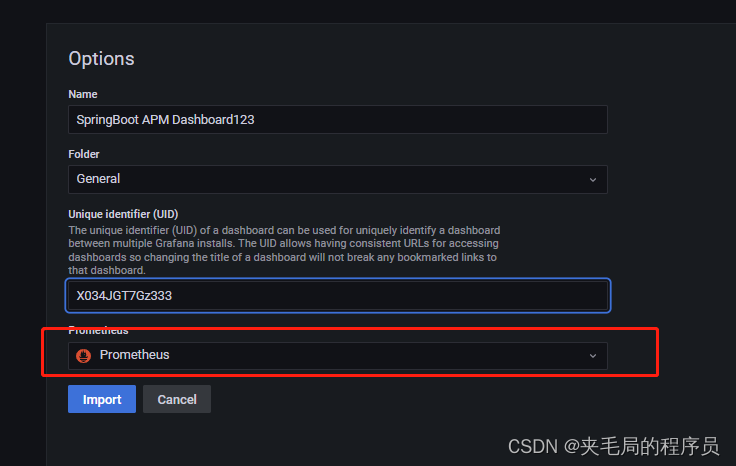
选择数据源和分类
![[外链图片转存失败,源站可能有防盗链机制,建议将图片保存下来直接上传(img-tsEWqyJ0-1655264375555)(https://gitee.com/jianimaoju/image-storage-service/raw/master/image/202206/15/113751-414673.png)]](https://img-blog.csdnimg.cn/6aeaa653bfa645af9f2563b0dfae0018.png)
-
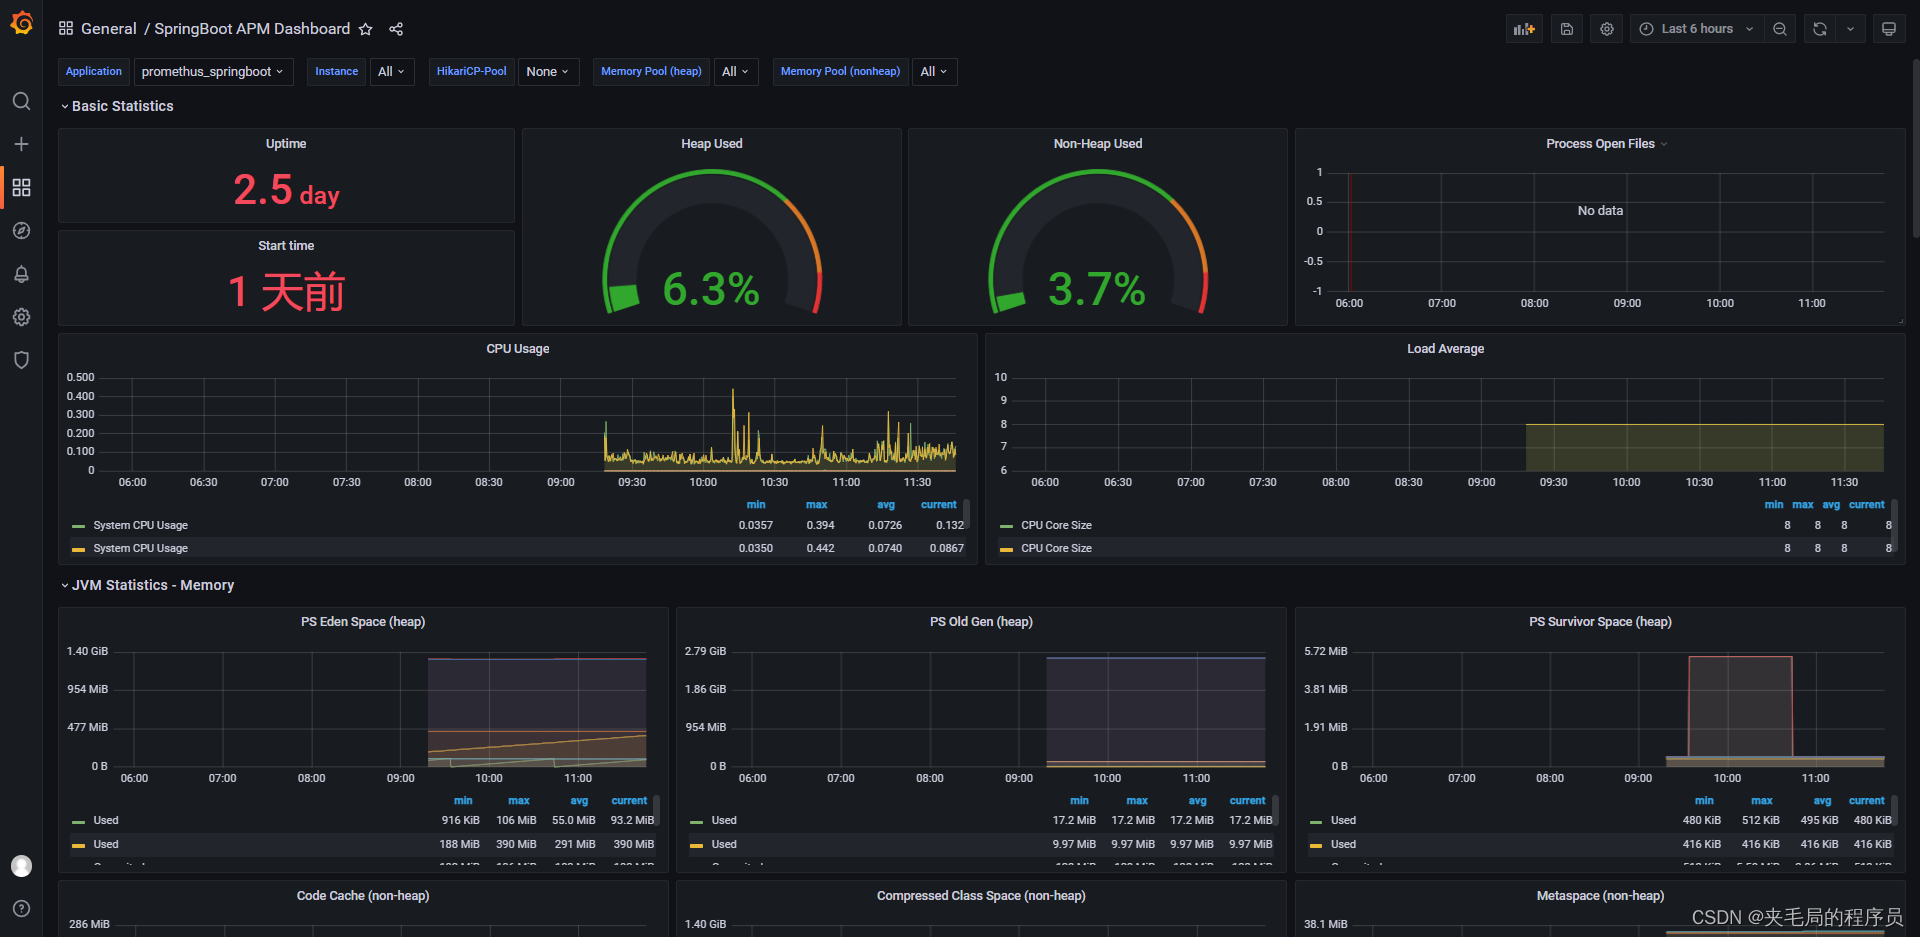
查看仪表盘效果


 6131
6131


 被折叠的 条评论
为什么被折叠?
被折叠的 条评论
为什么被折叠?
 到【灌水乐园】发言


