


介绍一下之前做的一个报告,数据为模拟数据
导pandas库
import pandas as pd
读取数据
df = pd.read_excel(‘10.xlsx’)
df
截取需要用到的字段
df1 = df.loc[:,[‘申请日期’,‘发国家受理书’,‘驳回情况’]]
df1
使用正则库提取‘驳回情况’列中的日期
import re
df2 = df1[‘驳回情况’].str.extract(’(\d+.\d+.\d+)’,expand=False)
df2

删除原有的驳回情况列,合并上正则筛选出的列
df1 = df1.drop(labels=‘驳回情况’,axis=1) # 删除驳回情况
new = pd.concat([df1,df2],axis=1) # 两个表合并
new
对两个日期相减
new1 = pd.DataFrame(pd.to_datetime(new[‘驳回情况’])-pd.to_datetime(new[‘申请日期’]),columns=[‘驳回日-申请日’])
new2 = pd.DataFrame(pd.to_datetime(new[‘驳回情况’])-pd.to_datetime(new[‘发国家受理书’]),columns=[‘驳回日-受理日’])

去掉后面的days,然后合并
new1 = new1[‘驳回日-申请日’].dt.days
new2 = new2[‘驳回日-受理日’].dt.days
new1
new_new = pd.concat([new,new1,new2],axis=1)
new_new
自定义函数
def fun(x):
if x>=360:
return ‘360天以上’
elif x>=180 and x<360:
return ‘180-360天’
elif x>=150 and x<180:
return ‘150-180天’
elif x>=120 and x<150:
return ‘120-150天’
elif x>=90 and x<120:
return ‘90-120天’
elif x>=60 and x<90:
return ‘60-90天’
elif x>=30 and x<60:
return ‘30-60天’
else:
return ‘30天内’
values = new_new[‘驳回日-申请日’].apply(lambda x: fun(x))
values2 = new_new[‘驳回日-受理日’].apply(lambda x: fun(x))
values

修改一下列明,然后合并
values = values.rename(‘驳回日-申请日分级’)
values2 = values2.rename(‘驳回日-受理日分级’)
new_new = pd.concat([new_new,values,values2],axis=1)
new_new
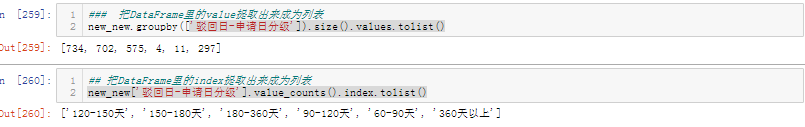
把DataFrame里的value提取出来成为列表
new_new.groupby([‘驳回日-申请日分级’]).size().values.tolist()
new_new.groupby([‘驳回日-受理日分级’]).size().values.tolist()
把DataFrame里的index提取出来成为列表
new_new[‘驳回日-申请日分级’].value_counts().index.tolist()
new_new[‘驳回日-受理日分级’].value_counts().index.tolist()
使用pyecharts库展示
bi展示
from pyecharts import options as opts
from pyecharts.charts import Bar, Timeline,Tab
from pyecharts.faker import Faker
图一
#for i in range(0,1):
bar = (
Bar()
.add_xaxis(list_index)
.add_yaxis(“分级”, list_value)
.add_yaxis(“专利”, zhuanli[i])
.set_global_opts(title_opts=opts.TitleOpts("202{}年商标驳回数量分析".format(i+1)))
)
bar.render_notebook()
图二
bar2 = (
Bar()
.add_xaxis(list2_index)
.add_yaxis(“分级”, list2_value)
.add_yaxis(“专利”, zhuanli[i])
.set_global_opts(title_opts=opts.TitleOpts("202{}年商标驳回数量分析".format(i+1)))
)
bar2.render_notebook()
创建组合类图表
tab = Tab()
tab.add(bar,‘按驳回日-申请日’)
tab.add(bar2,‘按驳回日-受理日’)
渲染数据
tab.render(‘商标驳回分析BI报表.html’)
tab.render_notebook()

结论:
。。。。。。。。。。结合数据得出结论,(对极值,平均值,中位数等等进行分析)


 242
242


 被折叠的 条评论
为什么被折叠?
被折叠的 条评论
为什么被折叠?
 到【灌水乐园】发言


