


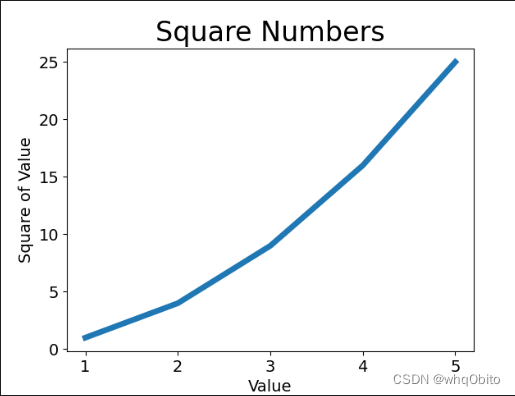
画一个线段图
代码如下
import matplotlib.pyplot as plt


input_values = [1, 2, 3, 4, 5]
squares = [1, 4, 9, 16, 25]

# 线条粗细
#第一个指定行坐标,第二个指定纵坐标
plt.plot(input_values, squares, linewidth=5)
# 标题
plt.title("Square Numbers", fontsize=24)
# 横坐标名字
plt.xlabel("Value", fontsize=14)
# 纵坐标名字
plt.ylabel("Square of Value", fontsize=14)
# 设置刻度标记的大小
plt.tick_params(axis='both', labelsize=14)
# plt.plot(squares)
plt.show()
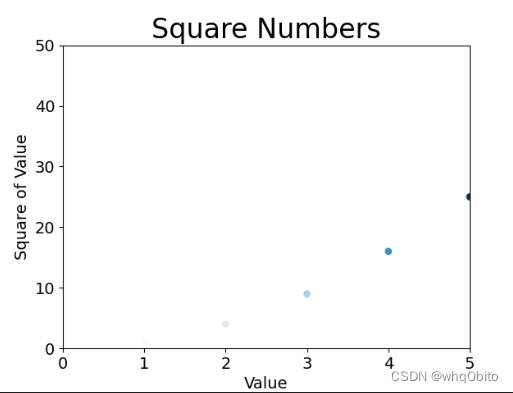
画一个散点图
具体代码如下
import matplotlib.pyplot as plt

# 第一个是x坐标,第二个y坐标,第三个大小
# 绘制一个点的情况
# plt.scatter(2, 4, s=200)
# 绘制多个点的情况
x_values = [1, 2, 3, 4, 5]
y_values = [1, 4, 9, 16, 25]
# (1,1),(2,4)
# edgecolor删除数据点的轮廓
#c是修改数据点的颜色
# plt.scatter(x_values, y_values, c='red', edgecolor='none', s=40)
# 颜色渐变,设置c和cmap
plt.scatter(x_values, y_values, c=y_values, cmap=plt.cm.Blues, edgecolor='none', s=40)
plt.title("Square Numbers", fontsize=24)
plt.xlabel("Value", fontsize=14)
plt.ylabel("Square of Value", fontsize=14)
# 设置刻度标记的大小
plt.tick_params(axis='both', which='major', labelsize=14)
# 设置每个坐标轴的取值范围,x是0-5,y是0-50
plt.axis([0, 5, 0, 50])

plt.show()
#保存为图片
plt.savefig('squares_plot.png', bbox_inches='tight')
想绘制更多其他的图表可以去官网查看
matlibplot
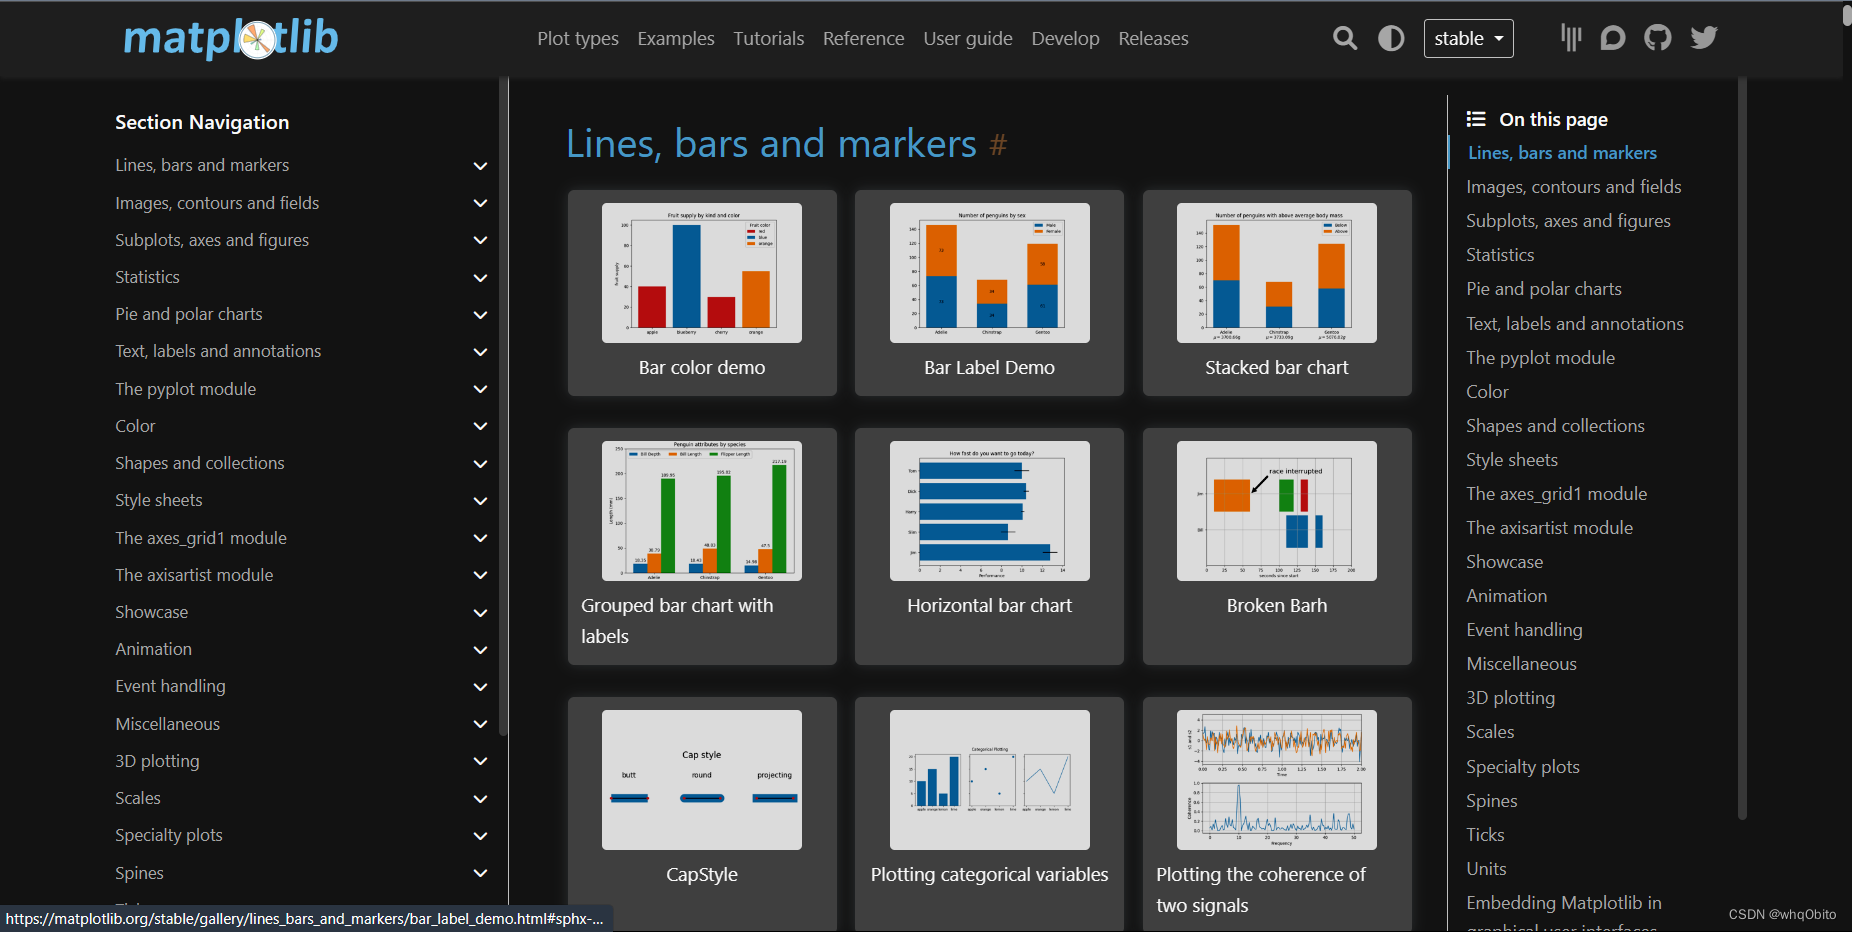
比如我们想绘制第一个图表,那么点击进入

可以看到,下面就是模板代码


 2076
2076


 被折叠的 条评论
为什么被折叠?
被折叠的 条评论
为什么被折叠?
 到【灌水乐园】发言


