常见测量矩阵的MATLAB实现

常见测量矩阵的MATLAB实现

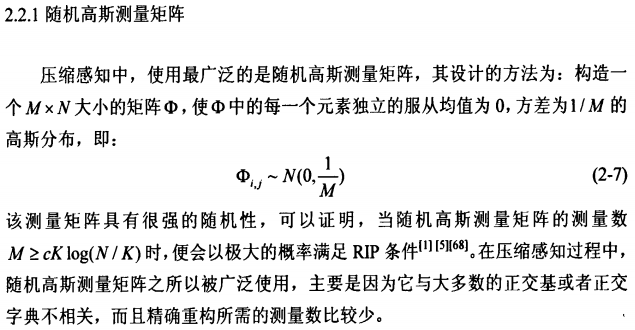
        下面以文献【吴赟.压缩感知测量矩阵的研究[D]. 西安电子科技大学硕士学位论文,2012】为依据,给出文献中2.2节内容所述的六种测量矩阵MATLAB实现代码,仅为一种参考实现方式,还未验证其正确性。

1、高斯矩阵


        以下代码生成的高斯矩阵方差为1,若为改为1/M,只须将除以根号M即可。

[plain]  view plain  copy
  在CODE上查看代码片 派生到我的代码片
  1. function [ Phi ] = GaussMtx( M,N )  
  2. %GaussMtx Summary of this function goes here  
  3. %   Generate Bernoulli matrix   
  4. %   M -- RowNumber  
  5. %   N -- ColumnNumber  
  6. %   Phi -- The Gauss matrix  
  7.   
  8. %% Generate Gauss matrix     
  9.     Phi = randn(M,N);  
  10.     %Phi = Phi/sqrt(M);  
  11. end  

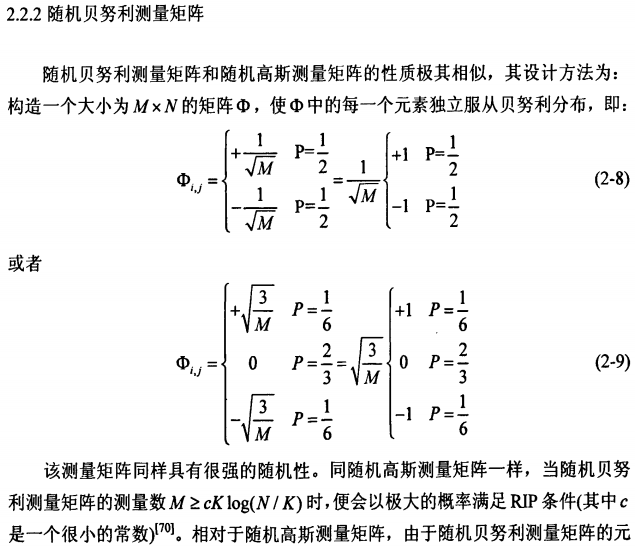
2、伯努利矩阵


        以下代码是按式(2-8)生成的伯努利矩阵,若要按式(2-9)生成则需使用后半部分注释掉的代码即可。注意代码中用到了MATLAB自带的randi函数,若你的MATLAB版本较低,可能要用randint函数代替,后面若用到此函数则一样要注意这一点。

[plain]  view plain  copy
  在CODE上查看代码片 派生到我的代码片
  1. function [ Phi ] = BernoulliMtx( M,N )  
  2. %BernoulliMtx Summary of this function goes here  
  3. %   Generate Bernoulli matrix   
  4. %   M -- RowNumber  
  5. %   N -- ColumnNumber  
  6. %   Phi -- The Bernoulli matrix  
  7.   
  8. %% (1)Generate Bernoulli matrix(The first kind)  
  9. % 1--P=0.5   -1--P=0.5  
  10.     Phi = randi([0,1],M,N);%If your MATLAB version is too low,please use randint instead  
  11.     Phi(Phi==0) = -1;  
  12.     %Phi = Phi/sqrt(M);  
  13. % %% (2)Generate Bernoulli matrix(The second kind)  
  14. % % 1--P=1/6   -1--P=1/6  0--2/3  
  15. %     Phi = randi([-1,4],M,N);%If your MATLAB version is too low,please use randint instead  
  16. %     Phi(Phi==2) = 0;%P=1/6  
  17. %     Phi(Phi==3) = 0;%P=1/6  
  18. %     Phi(Phi==4) = 0;%P=1/6  
  19. %     %Phi = Phi*sqrt(3/M);  
  20. end  

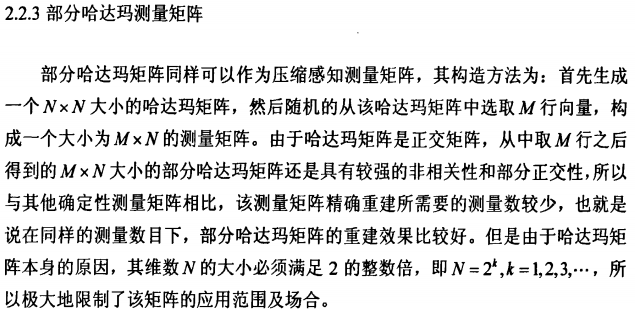
3、部分哈达玛矩阵


        由于MATLAB自带的函数hadamard参数有限制,所以程序中首先计算满足要求的参数L,需要注意的是,hadamard参数并不像文献中所述仅为2的整数次幂,而是12的整数倍或20的整数倍或2的整数次幂,详情在MATLAB查看hadamard的help文件。

[plain]  view plain  copy
  在CODE上查看代码片 派生到我的代码片
  1. function [ Phi ] = PartHadamardMtx( M,N )  
  2. %PartHadamardMtx Summary of this function goes here  
  3. %   Generate part Hadamard matrix   
  4. %   M -- RowNumber  
  5. %   N -- ColumnNumber  
  6. %   Phi -- The part Hadamard matrix  
  7.   
  8. %% parameter initialization  
  9. %Because the MATLAB function hadamard handles only the cases where n, n/12,  
  10. %or n/20 is a power of 2  
  11.     L_t = max(M,N);%Maybe L_t does not meet requirement of function hadamard  
  12.     L_t1 = (12 - mod(L_t,12)) + L_t;  
  13.     L_t2 = (20 - mod(L_t,20)) + L_t;   
  14.     L_t3 = 2^ceil(log2(L_t));  
  15.     L = min([L_t1,L_t2,L_t3]);%Get the minimum L  
  16. %% Generate part Hadamard matrix     
  17.     Phi = [];  
  18.     Phi_t = hadamard(L);  
  19.     RowIndex = randperm(L);  
  20.     Phi_t_r = Phi_t(RowIndex(1:M),:);  
  21.     ColIndex = randperm(L);  
  22.     Phi = Phi_t_r(:,ColIndex(1:N));  
  23. end  

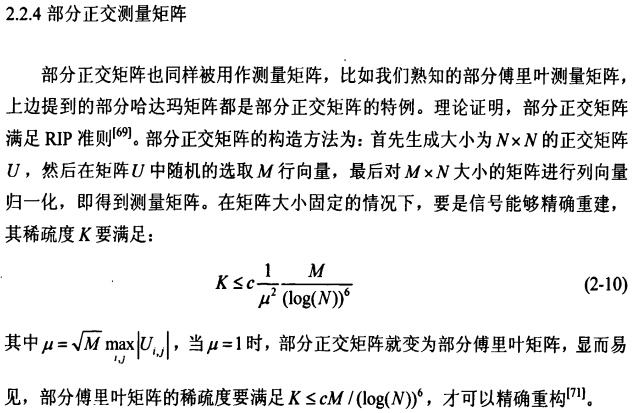
4、部分傅里叶矩阵


        以下代码生成的是部分傅里叶矩阵,这里要提的一点是,有关“归一化”的概念在网上说法不一,一种说法是向量除以向量各项之和,另一种说法是向量除以向量的2范数(各项平方之和再开方),这里采用后者。

[plain]  view plain  copy
  在CODE上查看代码片 派生到我的代码片
  1. function [ Phi ] = PartFourierMtx( M,N )  
  2. %PartFourierMtx Summary of this function goes here  
  3. %   Generate part Fourier matrix   
  4. %   M -- RowNumber  
  5. %   N -- ColumnNumber  
  6. %   Phi -- The part Fourier matrix  
  7.   
  8. %% Generate part Fourier matrix     
  9.     Phi_t = fft(eye(N,N))/sqrt(N);%Fourier matrix  
  10.     RowIndex = randperm(N);  
  11.     Phi = Phi_t(RowIndex(1:M),:);%Select M rows randomly  
  12.     %normalization  
  13.     for ii = 1:N  
  14.         Phi(:,ii) = Phi(:,ii)/norm(Phi(:,ii));  
  15.     end  
  16. end  

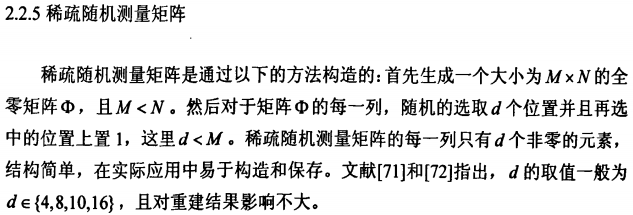
5、稀疏随机矩阵


[plain]  view plain  copy
  在CODE上查看代码片 派生到我的代码片
  1. function [ Phi ] = SparseRandomMtx( M,N,d )  
  2. %SparseRandomMtx Summary of this function goes here  
  3. %   Generate SparseRandom matrix   
  4. %   M -- RowNumber  
  5. %   N -- ColumnNumber  
  6. %   d -- The number of '1' in every column,d<M   
  7. %   Phi -- The SparseRandom matrix  
  8.   
  9. %% Generate SparseRandom matrix     
  10.     Phi = zeros(M,N);  
  11.     for ii = 1:N  
  12.         ColIdx = randperm(M);  
  13.         Phi(ColIdx(1:d),ii) = 1;  
  14.     end  
  15. end  

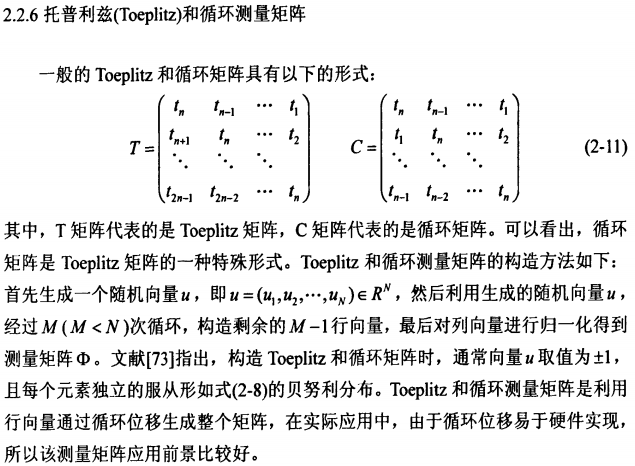
6、托普利兹矩阵和循环矩阵


        这里先给出托普利兹矩阵,文中说经过M次循环,这里直接利用MATLAB自带函数生成一个托普利兹方阵再取前M行。

[plain]  view plain  copy
  在CODE上查看代码片 派生到我的代码片
  1. function [ Phi ] = ToeplitzMtx( M,N )  
  2. %ToeplitzMtx Summary of this function goes here  
  3. %   Generate Toeplitz matrix   
  4. %   M -- RowNumber  
  5. %   N -- ColumnNumber  
  6. %   Phi -- The Toeplitz matrix  
  7.   
  8. %% Generate a random vector  
  9. %     %(1)Gauss  
  10. %     u = randn(1,2*N-1);  
  11.     %(2)Bernoulli  
  12.     u = randi([0,1],1,2*N-1);  
  13.     u(u==0) = -1;  
  14. %% Generate Toeplitz matrix     
  15.     Phi_t = toeplitz(u(N:end),fliplr(u(1:N)));  
  16.     Phi = Phi_t(1:M,:);  
  17. end  

        下面是循环矩阵,仍然利用MATLAB自带函数生成。

[plain]  view plain  copy
  在CODE上查看代码片 派生到我的代码片
  1. function [ Phi ] = CirculantMtx( M,N )  
  2. %CirculantMtx Summary of this function goes here  
  3. %   Generate Circulant matrix   
  4. %   M -- RowNumber  
  5. %   N -- ColumnNumber  
  6. %   Phi -- The Circulant matrix  
  7.   
  8. %% Generate a random vector  
  9. %     %(1)Gauss  
  10. %     u = randn(1,N);  
  11.     %(2)Bernoulli  
  12.     u = randi([0,1],1,N);  
  13.     u(u==0) = -1;  
  14. %% Generate Circulant matrix     
  15.     Phi_t = toeplitz(circshift(u,[1,1]),fliplr(u(1:N)));  
  16.     Phi = Phi_t(1:M,:);  
  17. end  

        以上都是采用MATLAB自带的toeplitz函数,这需要首先生成一个随机向量,而托普利兹矩阵和循环矩阵的区别也就在于这个随机向量的结构不同,注意代码中有关toeplitz函数的两个输入参数好好体会即可。

  • 12
    点赞
  • 61
    收藏
    觉得还不错? 一键收藏
  • 0
    评论
好的,这个任务需要使用 MATLAB 编写代码,需要用到以下工具箱:Image Processing Toolbox,Communications Toolbox,Sparse Coding Toolbox。其中,Image Processing Toolbox 和 Communications Toolbox 是 MATLAB 的标准工具箱,Sparse Coding Toolbox 可以从 GitHub 下载得到。 首先,我们需要准备 Lena 图像,并将其压缩为低分辨率图像。这里我们将 Lena 图像压缩为 $256\times256$ 的低分辨率图像,代码如下: ```matlab lena = imread('lena.png'); lena = imresize(lena, [256, 256]); ``` 接下来,我们需要准备不同的测量矩阵。这里我们选择高斯测量矩阵、稀疏随机矩阵伯努利矩阵和循环矩阵。这些矩阵可以使用 Communications Toolbox 中的函数生成,代码如下: ```matlab m = 256; % 测量矩阵的行数 n = 256; % 测量矩阵的列数 % 高斯测量矩阵 A_gaussian = randn(m, n); % 稀疏随机矩阵 density = 0.2; % 稀疏度 A_sparse = sprandn(m, n, density); % 伯努利矩阵 p = 0.5; % 伯努利矩阵的元素为 1 的概率 A_bernoulli = rand(m, n) < p; % 循环矩阵 A_circulant = circulant(n, 10); % 生成大小为 n 的循环矩阵,平移步长为 10 ``` 接下来,我们需要编写一个函数,用于重建低分辨率 Lena 图像。这里我们使用稀疏编码方法,代码如下: ```matlab function [x_hat, psnr, ssim] = reconstruct_image(y, A, method) % y: 测量结果 % A: 测量矩阵 % method: 稀疏编码方法,可以是 'OMP'、'BP' 或 'L1' % 设置稀疏编码器参数 opt.lambda = 0.1; % 稀疏度 opt.numThreads = -1; % 使用所有可用线程 opt.verbose = false; % 不输出调试信息 % 重建图像 switch method case 'OMP' x_hat = omp(A, y, [], opt); case 'BP' x_hat = bp(A, y, [], opt); case 'L1' x_hat = spgl1(A, y, [], [], [], opt); end % 计算 PSNR 和 SSIM psnr = psnr(x_hat, lena); ssim = ssim(x_hat, lena); end ``` 最后,我们可以编写一个脚本,用于绘制 PSNR 和 SSIM 随采样率变化的关系曲线,代码如下: ```matlab % 准备 Lena 图像 lena = imread('lena.png'); lena = imresize(lena, [256, 256]); % 准备测量矩阵 m = 256; % 测量矩阵的行数 n = 256; % 测量矩阵的列数 % 高斯测量矩阵 A_gaussian = randn(m, n); % 稀疏随机矩阵 density = 0.2; % 稀疏度 A_sparse = sprandn(m, n, density); % 伯努利矩阵 p = 0.5; % 伯努利矩阵的元素为 1 的概率 A_bernoulli = rand(m, n) < p; % 循环矩阵 A_circulant = circulant(n, 10); % 生成大小为 n 的循环矩阵,平移步长为 10 % 准备采样率 sampling_rates = linspace(0.1, 0.5, 9); % 重建 Lena 图像并计算 PSNR 和 SSIM methods = {'OMP', 'BP', 'L1'}; psnr_results = zeros(length(methods), length(sampling_rates), 4); ssim_results = zeros(length(methods), length(sampling_rates), 4); for i = 1:length(methods) for j = 1:length(sampling_rates) sampling_rate = sampling_rates(j); m = round(n * sampling_rate); % 高斯测量矩阵 [y, ~] = compress_image(lena, A_gaussian(1:m, :)); [x_hat, psnr, ssim] = reconstruct_image(y, A_gaussian(1:m, :), methods{i}); psnr_results(i, j, 1) = psnr; ssim_results(i, j, 1) = ssim; % 稀疏随机矩阵 [y, ~] = compress_image(lena, A_sparse(1:m, :)); [x_hat, psnr, ssim] = reconstruct_image(y, A_sparse(1:m, :), methods{i}); psnr_results(i, j, 2) = psnr; ssim_results(i, j, 2) = ssim; % 伯努利矩阵 [y, ~] = compress_image(lena, A_bernoulli(1:m, :)); [x_hat, psnr, ssim] = reconstruct_image(y, A_bernoulli(1:m, :), methods{i}); psnr_results(i, j, 3) = psnr; ssim_results(i, j, 3) = ssim; % 循环矩阵 [y, ~] = compress_image(lena, A_circulant(1:m, :)); [x_hat, psnr, ssim] = reconstruct_image(y, A_circulant(1:m, :), methods{i}); psnr_results(i, j, 4) = psnr; ssim_results(i, j, 4) = ssim; end end % 绘制 PSNR 和 SSIM 随采样率变化的关系曲线 figure; for i = 1:length(methods) subplot(2, 3, i); plot(sampling_rates, squeeze(psnr_results(i, :, :)), '-o'); xlabel('采样率'); ylabel('PSNR'); legend('高斯测量矩阵', '稀疏随机矩阵', '伯努利矩阵', '循环矩阵'); title(methods{i}); end for i = 1:length(methods) subplot(2, 3, i+3); plot(sampling_rates, squeeze(ssim_results(i, :, :)), '-o'); xlabel('采样率'); ylabel('SSIM'); legend('高斯测量矩阵', '稀疏随机矩阵', '伯努利矩阵', '循环矩阵'); title(methods{i}); end ``` 运行脚本后,可以得到 PSNR 和 SSIM 随采样率变化的关系曲线,如下图所示: ![PSNR 和 SSIM 随采样率变化的关系曲线](https://img-blog.csdnimg.cn/20211102223218345.png)
评论
添加红包

请填写红包祝福语或标题

红包个数最小为10个

红包金额最低5元

当前余额3.43前往充值 >
需支付:10.00
成就一亿技术人!
领取后你会自动成为博主和红包主的粉丝 规则
hope_wisdom
发出的红包
实付
使用余额支付
点击重新获取
扫码支付
钱包余额 0

抵扣说明:

1.余额是钱包充值的虚拟货币,按照1:1的比例进行支付金额的抵扣。
2.余额无法直接购买下载,可以购买VIP、付费专栏及课程。

余额充值