


1.概述
QwtPlotCurve是用于绘制曲线图的类。通过QwtPlotCurve,可以将数据点绘制为平滑的曲线,并可以设置曲线的颜色、线宽和线样式等属性。QwtPlotCurve还提供了许多操作和显示曲线数据的方法,例如添加数据点、清空数据、设置数据符号等。
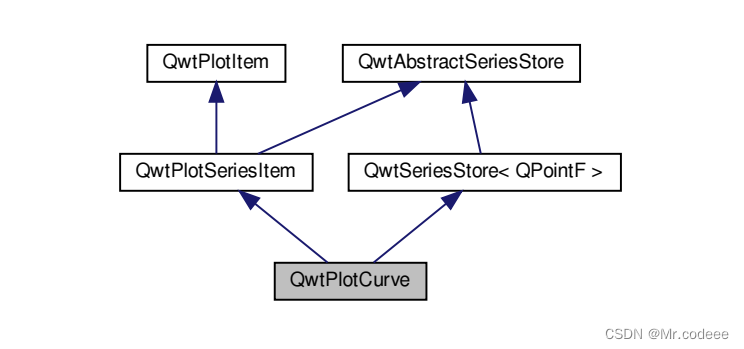
以下是类继承关系图:
2.常用接口介绍
2.1数据操作
setRawSamples(const double *xData, const double *yData, int size):设置曲线的原始数据,传入x轴和y轴数据数组以及数据的长度。

setSamples(QVector<QPointF> samples):设置曲线的数据,传入QVector类型的数据点向量。

setSamples(const QPolygonF &samples):设置曲线的数据,传入QPolygonF类型的数据点多边形。

setSamples(QwtSeriesData<QPointF> *data):设置曲线的数据,传入QwtSeriesData类型的数据对象。

setSymbol(QwtSymbol *symbol):设置曲线上数据点的符号样式。

setStyle(QwtPlotCurve::CurveStyle style):设置曲线的样式,可选择线性、阶梯瀑布等多种样式。
2.2曲线属性设置
setPen(const QPen &pen):设置绘制曲线的画笔。

setBrush(const QBrush &brush):设置填充曲线区域的画刷。

setTitle(const QString &title):为曲线设置标题。

attach(QwtPlot *plot)和detach():将曲线附加到或从QwtPlot中分离
2.3设置风格
setStyle(QwtPlotCurve::CurveStyle style):设置曲线的样式。可选择线性、阶梯瀑布等多种样式来绘制曲线。2.4设置图例的属性
void setLegendAttribute (LegendAttribute, bool on=true)
2.5绘制曲线上的数据点。通过传入绘图所需的QPainter对象、坐标映射、绘图区域以及要绘制的数据点范围,可以绘制曲线上的数据点。
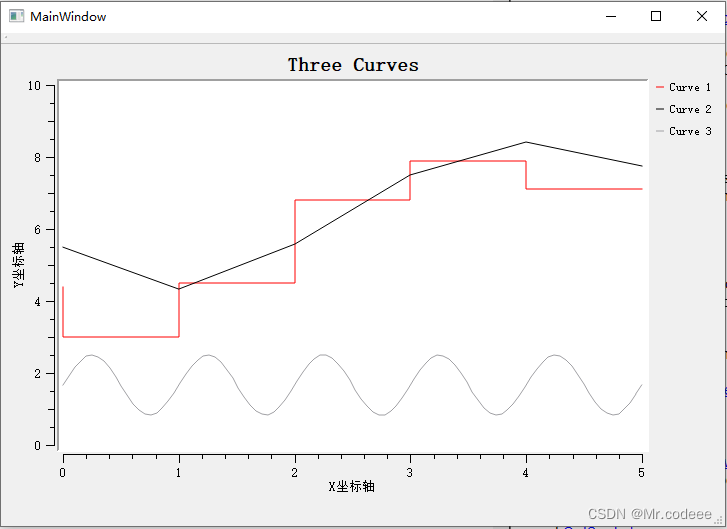
drawSymbols(QPainter *painter, const QwtScaleMap &xMap, const QwtScaleMap &yMap, const QRectF &canvasRect, int from, int to) const3.示例
#include "mainwindow.h"
#include "ui_mainwindow.h"
#include "qwt_plot.h"
#include "qwt_plot_curve.h"
#include "qwt_text.h"
#include "qwt_legend.h"
#include "qwt_symbol.h"

MainWindow::MainWindow(QWidget *parent) :
    QMainWindow(parent),
    ui(new Ui::MainWindow)
{
    ui->setupUi(this);

    QwtPlot *plot = new QwtPlot(QwtText("Three Curves"),this);
    //设置背景色
    plot->setCanvasBackground(QBrush(QColor(Qt::white)));

    //添加图例
    QwtLegend *legend = new QwtLegend();
    plot->insertLegend(legend);

    //设置坐标轴标题
    plot->setAxisTitle(QwtAxis::YLeft,QwtText("Y坐标轴"));
    plot->setAxisTitle(QwtAxis::XBottom,QwtText("X坐标轴"));
    plot->setAxisScale(QwtAxis::YLeft, 0, 10);//设置左Y轴范围

    // add curves1
    QwtPlotCurve *curve1 = new QwtPlotCurve( "Curve 1" );
    curve1->setRenderHint( QwtPlotItem::RenderAntialiased );
    curve1->setPen( Qt::red );
    //curve1->setBrush(QBrush(QColor(Qt::red)));
    curve1->setLegendAttribute( QwtPlotCurve::LegendShowLine );
    curve1->setYAxis( QwtAxis::YLeft );
    curve1->setStyle(QwtPlotCurve::Steps);
    curve1->attach( plot );


    // add curves2
    QwtPlotCurve *curve2 = new QwtPlotCurve( "Curve 2" );
    curve2->setRenderHint( QwtPlotItem::RenderAntialiased );
    curve2->setPen( Qt::black );
    //curve2->setBrush(QBrush(QColor(Qt::black)));
    curve2->setLegendAttribute( QwtPlotCurve::LegendShowLine );
    curve2->setYAxis( QwtAxis::YRight );
    curve2->setStyle(QwtPlotCurve::Lines);
    curve2->attach( plot );

    // add curves3
    QwtPlotCurve *curve3 = new QwtPlotCurve( "Curve 3" );
    curve3->setRenderHint( QwtPlotItem::RenderAntialiased );
    curve3->setPen( Qt::gray );
    //curve3->setBrush(QBrush(QColor(Qt::black)));
    curve3->setLegendAttribute( QwtPlotCurve::LegendShowLine );
    curve3->setYAxis( QwtAxis::YRight );
    curve3->setStyle(QwtPlotCurve::Lines);
    curve3->attach( plot );


    //设置数据
    QPolygonF points;
    points << QPointF( 0.0, 4.4 ) << QPointF( 1.0, 3.0 )
           << QPointF( 2.0, 4.5 ) << QPointF( 3.0, 6.8 )
           << QPointF( 4.0, 7.9 ) << QPointF( 5.0, 7.1 );
    curve1->setSamples(points);

    QPolygonF points2;
    points2 << QPointF( 0.0, 4.6 ) << QPointF( 1.0, 3.2 )
           << QPointF( 2.0, 4.7 ) << QPointF( 3.0, 7.0 )
           << QPointF( 4.0, 8.1 ) << QPointF( 5.0, 7.3 );
    curve2->setSamples(points2);

    int numPoints = 100;
    QVector<QPointF> points3;
    for (int i = 0; i < numPoints; ++i) {
       double x = 5*i / (double)(numPoints - 1); // x范围从0到5
       double y = sin(2 * M_PI * x); // 计算sin函数的y值
       points3.append(QPointF(x, y));
    }

    curve3->setSamples(points3);

    // finally, refresh the plot
    plot->replot();

    ui->verticalLayout->addWidget(plot);
}

MainWindow::~MainWindow()
{
    delete ui;
}


 2万+
2万+


 被折叠的 条评论
为什么被折叠?
被折叠的 条评论
为什么被折叠?
 到【灌水乐园】发言


