


this.pieDatas = [
[{
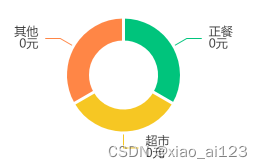
name: '正餐',
value: tmpObj.canteenAmount
}, {
name: '超市',
value: tmpObj.supermarketAmount
}, {
name: '其他',
value: tmpObj.otherAmount
}]
];
piechart: function() {
var myChart = echarts.init(document.getElementById('consumer-preferences-pie'));
var option = {
tooltip: {
trigger: 'item'
},
series: this.pieDatas.map(function(data, idx) {
return {
type: 'pie',
radius: ['33', '58'],
data: data,
itemStyle: {
borderColor: '#fff',
borderWidth: 3,
},
label: {
formatter: function(e) {
return e.name + "\n" + e.value + '元';
},
padding: [0, 2],
rich: {
color: 'rgba(0, 0, 0, 0.85)',
fontSize: 12,
fontFamily: 'PingFangSC-Regular, PingFang SC',
fontWeight: 400,
lineHeight: 17
}
}
};
}),
color: ['#00C47C', '#F6C723', '#FF8646']
};
option && myChart.setOption(option);
window.addEventListener('resize', function() {
myChart.resize();
})
}
<style>
#consumer-preferences-pie {
height: 385rpx;
top: -60rpx;
z-index: 100;
}
</style>


 2万+
2万+


 被折叠的 条评论
为什么被折叠?
被折叠的 条评论
为什么被折叠?
 到【灌水乐园】发言


