


原文:http://www.codeproject.com/Articles/13725/Getting-started-with-SQL-Server-Reporting-Services
Introduction
Microsoft has come up with its own reporting service, in conjuction with SQL server database to introduce the Microsoft SQL Server Reporting services[SSRS]. It provides projects of type Business Intelligence Project thus enabling not only large companies but also medium-sized and small companies also to earn from its benefits. This aids in better business decisions too.
SSRS provides several extensions towards the data rendering, delivery and security of reports thereby allowing it to have a higher programmable ability. This innovative approach enables reports to be created with lesser development effort[compared to other reporting services], along with customized security options.
SSRS is a comprehensive reporting platform whereby reports are stored on a centralized web server (or set of servers). Because reports are centralized, users run reports from one place. Having centralized reports also means that report deployment is quite simplified.
Architecture
After using SSRS, the architecture is just like a small operating system. The Report Manager is the central person who acts as a manager to decide when the reports will be scheduled to run along with maintaining the user profiles on the report server. Also, you can ask the report manager to view or search certain reports. He also helps in site property configuration and folder management in the report server.
There is something known as a Report Server, at which all the reports reside. All other activities pertaining to SSRS is done at report server. I believe it acts like a workstation for the reporting tool.
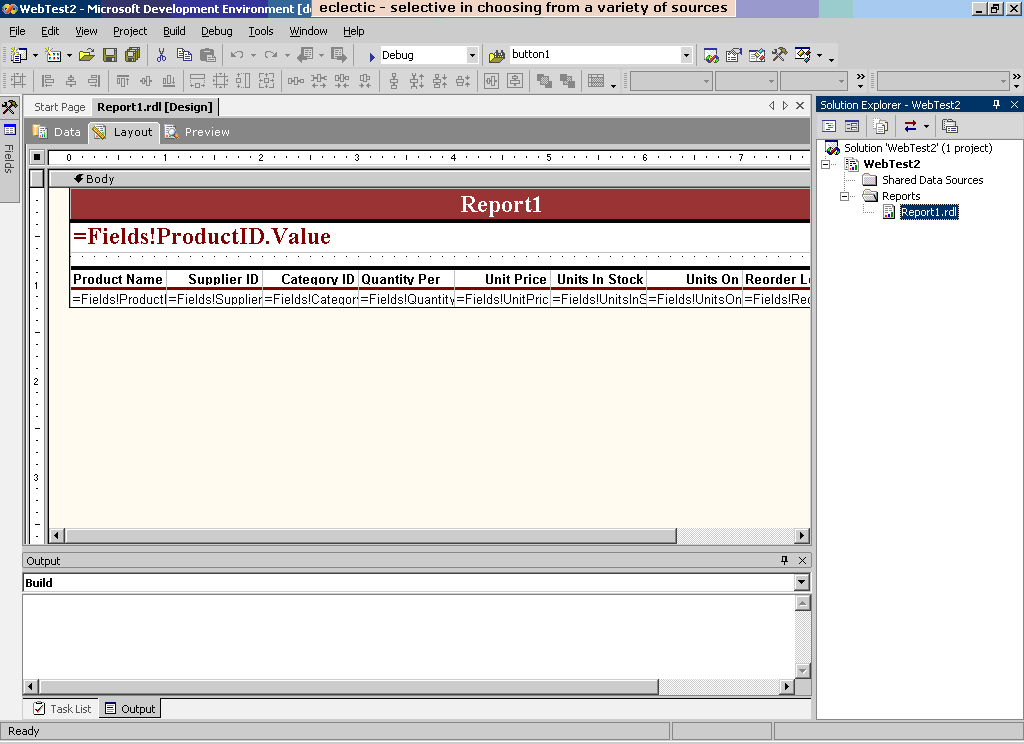
Report Designer is basically a graphical tool that are hosted within the Microsoft Visual Studio IDE. Report Designer provides a tabbed windows for Data, Layout, and Preview that allow you to design a report interactively. You can add datasets to accommodate a new report design idea, or adjust report layout based on preview results. Also, he provides query builders, an Expression editor, and wizards to step you through the process of creating a simple report.
There is also a Scheduling and Delivery processor who pushes the reports to email inboxes or ftp locations. Like an operating system the adds processes to the queue, the Scheduling and Delivery processor adds processed[executed by the report processor] reports to the queue.
The Report Processor, as the name suggests, executes the reports present in the server. Now that we know the basics of SSRS, lets get starting with our first report.
Getting Started
After installing SQL server reporting services on your system, start the Visual studio IDE.
Go to File -> New Project, and you will be shown a prompt with 'New project'.
Select Business Intelligence Projects from the Project Types. As this is our first project, use Report Project Wizard in the templates pane.
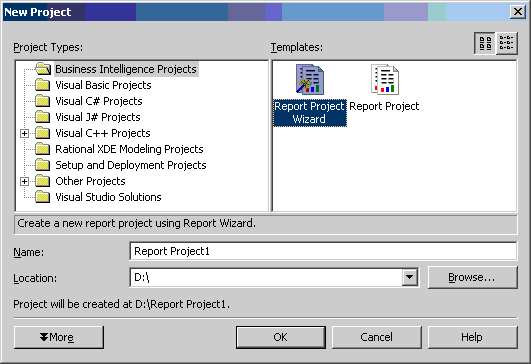
Specify the name of the project as well as the location where the project will be placed.
On click of OK, you will be prompted with a report wizard screen. Click on Next to follow up to the next screen.

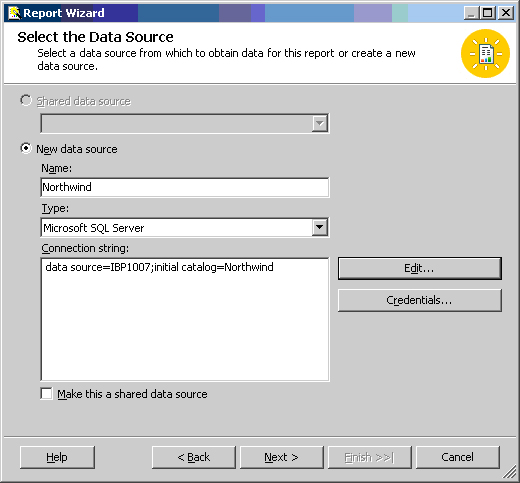
On the next screen, you will need to create a datasource for the report. This screen is similar to the Connection string creation wizard on creation of a udl file. However, here you just need to click on Edit to specify the server name and the database the will be used from that server. The connection string is automatically created.
This datasource can be made as a shared datasource for multiple reports to access. This can be done by checking in the checkbox present below.
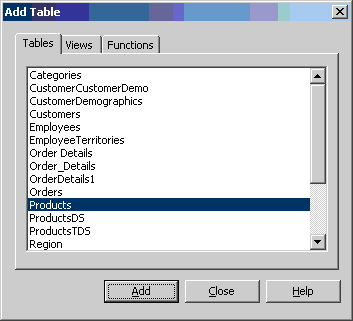
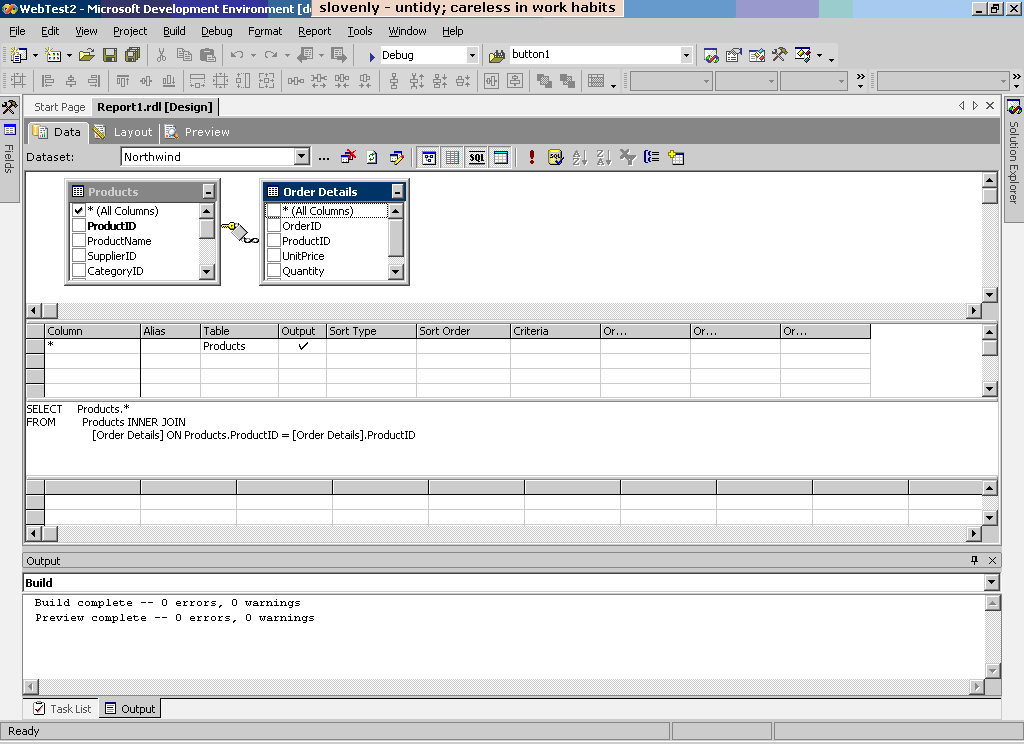
On click of Next, you will be prompted with the Query Builder screen. Here you can add tables, select columns as well as execute the SQL statements therby created.

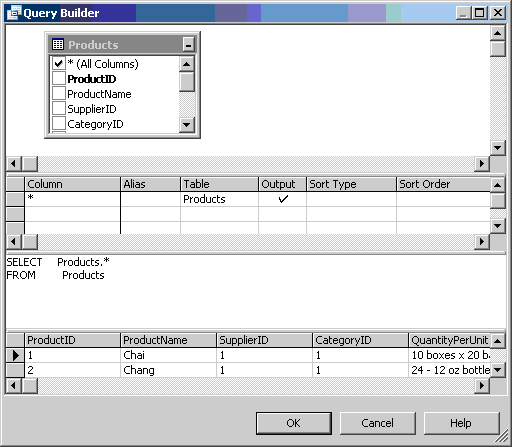
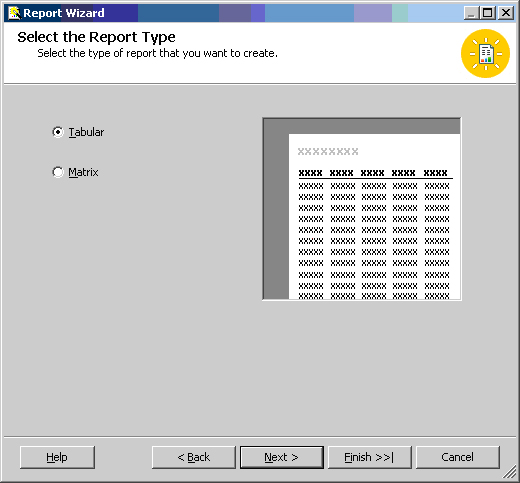
Based on what query suits your report, create the SQL statement and proceed forward. On next click, you will be prompted with the report type screen. You can choose as Tabular or matrix. To make things simpler, use the Tabular format.
On next click, you will come to the table designing screen, wherein you will be prompted to display the fields as Page, Group or Details. The relevant locations where the fields will be placed is shown at the side.

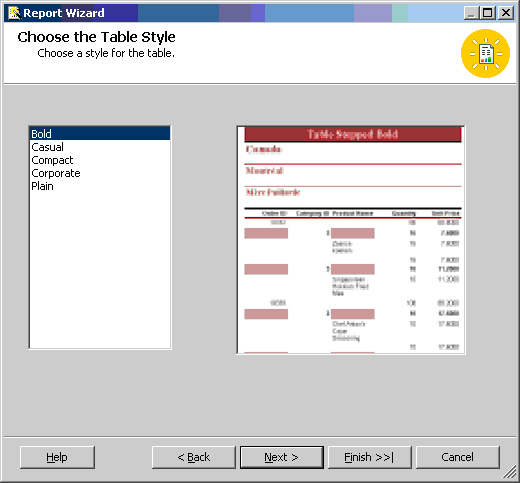
On next click, you will be prompted with the Table Style prompt, which contains a list to choose. Select any from them .
On next, you will be prompted with the deployment details screen. Specify the report server name ; normally it ishttp://localhost/ReportServer. if you are using another server then you can specify the location ashttp://servername/ReportServer . Also provide in the deployment folder.

Finally, the Report name needs to be entered and voila, you got your first report in place.

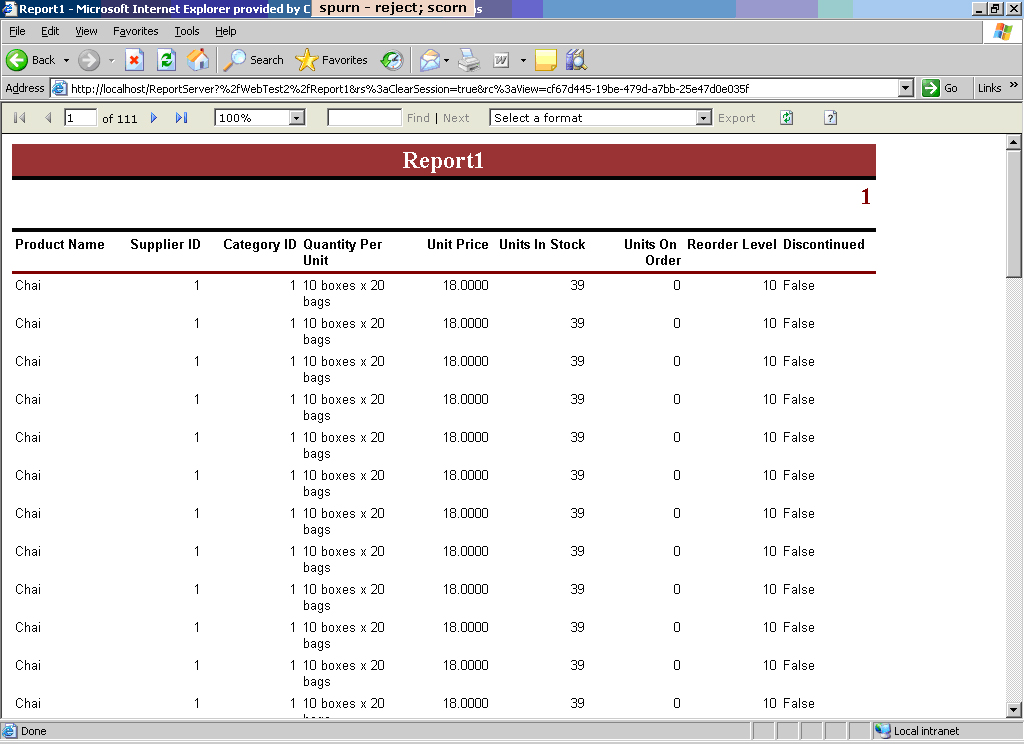
You can preview the report to change the data specs using the 3 tabs from the report designer - as mentioned previously.
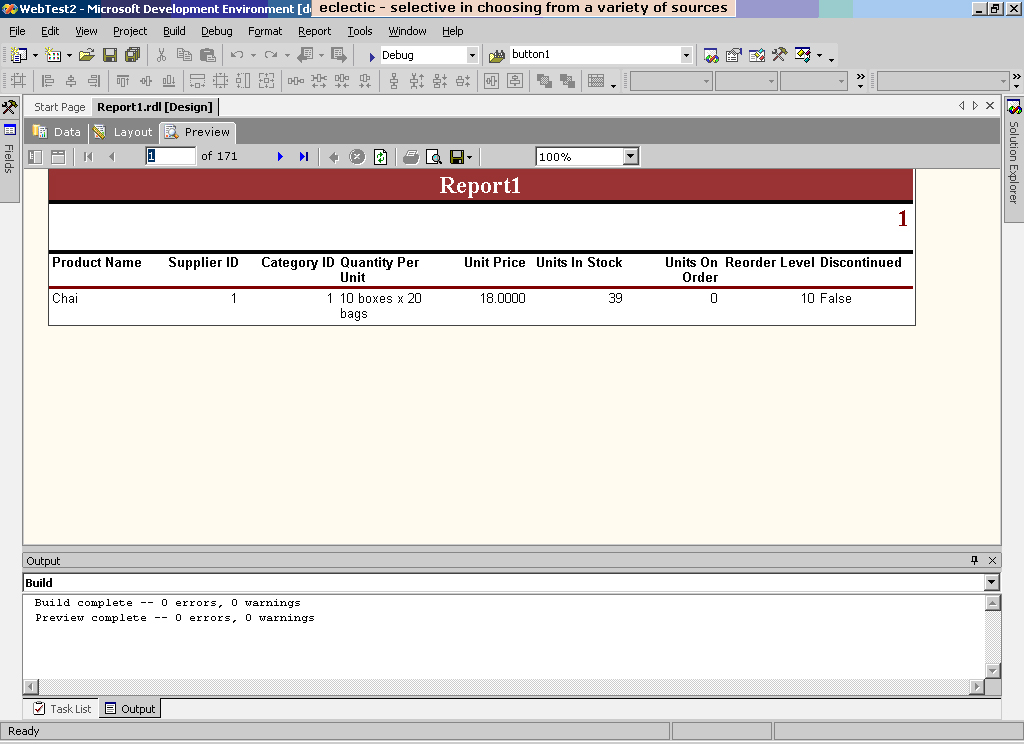
Finally, click on Ctr+F5 and the deployment of the report will occur.
Incase you have any problems in creating your SQL server report, please let me know.


 4689
4689


 被折叠的 条评论
为什么被折叠?
被折叠的 条评论
为什么被折叠?
 到【灌水乐园】发言


