


本文将学习三个图形函数——stem, staris,pie.
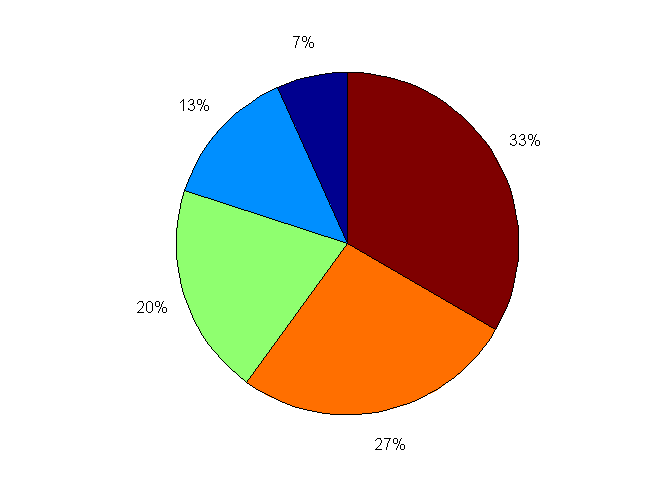
%% pie用于描绘平面饼图
X = [1, 2, 3, 4, 5];
 pie(X)
%% 画饼状图
 Expenses = [20 10 40 12 20 19 5 15];
ExpenseCategories = {'Food','Medical','Lodging','Incidentals','Transport','Utilities','Gifts','Shopping'};
MostLeastExpensive = (Expenses==max(Expenses)|Expenses==min(Expenses));
h=pie(gca,Expenses,MostLeastExpensive,ExpenseCategories);

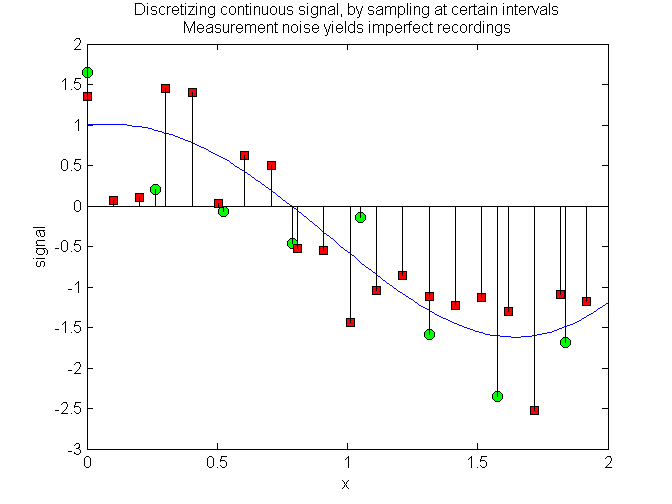
%% stem用于画离散的数据序列
x = linspace(0,2,100);
x1 = x(1:13:end);
x2 = x(1:5:end);
y = exp(.3*x).*cos(-2*x);
yy = round(rand(1,length(x1)));yy(find(yy==0))=-1;
y1 = exp(.3*x1).*cos(-2*x1)+yy.*rand(1,length(x1));
yy = round(rand(1,length(x2)));yy(find(yy==0))=-1;
y2 = exp(.3*x2).*cos(-2*x2)+yy.*rand(1,length(x2));
plot(x,y); hold on;
h1 = stem(x1,y1);
h2 = stem(x2,y2);
% Choose marker size and style of your choice
set(h1,'MarkerFaceColor','green','Marker','o','Markersize',7,'Color',[0 0 0]);
set(h2,'MarkerFaceColor','red','Marker','square','Color',[0 0 0]);
xlabel('x');ylabel('signal');
title({'Discretizing continuous signal, by sampling at certain intervals','Measurement noise yields imperfect recordings'});
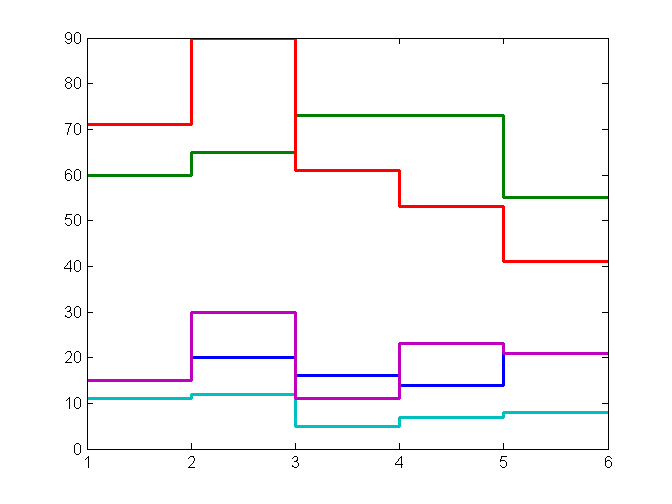
load algoResultsData.mat
h=stairs([MethodPerformanceNumbers nan(5,1)]');
legendMatrix = {'Fresh Tissue','FFPE','Blood','DNA','Simulated'};
for i = 1:5;
    set(h(i),'linewidth',2); % thicken the lines
    % add total # of samples in this category tolegend
    legendMatrix{i} = [legendMatrix{i} ', Total# = ' num2str(CategoryTotals(i))];
end
这篇只是简单的用了三个函数。另外还有pie3,scatter,bar, plot, plotyy这些函数,大家可以去help里面学习下。
另外补充下,在matlab官网看到一个函数pie3s,很漂亮的图,
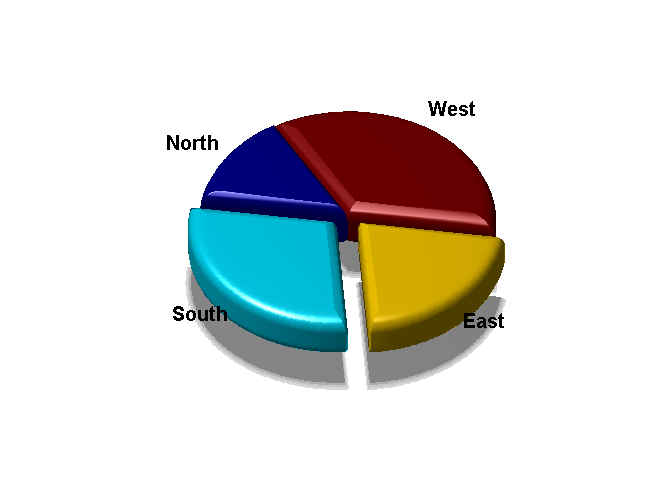
pie3s([2 4 3 5],'Explode',[0 1 1 0],'Labels',{'North','South','East','West'})
pie3s 代码:
function pie3s( varargin )
%PIE3S: 3-D pie chart with added shininess
%
%   PIE3S(X) draws a 3-D pie plot of the data in the vector X.  The values
%   in X are normalized vi
最低0.47元/天 解锁文章


 5742
5742


 被折叠的 条评论
为什么被折叠?
被折叠的 条评论
为什么被折叠?
 到【灌水乐园】发言


