


当图像复杂的时候,通常添加符号,线条的风格,颜色从而区别显示。Figure legenf帮助我们整理,有时候有许多变量需要我们去编码,
这里我们使用legned去满足我们的需求。
部分代码:
% Define a matrix of line spec options
LineStyles = {'-'}; % solid line
MarkerSpecs = {'+','o'}; % plus, circle ... there are more
ColorSpecs = {'r','g','b','k','m'}; % red, green, blue, black ... there are more
cnt = 1;
for i = 1:length(LineStyles)
    for j = 1:length(MarkerSpecs)
        for k = 1:length(ColorSpecs)
            LineSpecs{cnt} = [LineStyles{i} MarkerSpecs{j} ColorSpecs{k}];
            cnt = cnt+1;
        end
    end
end
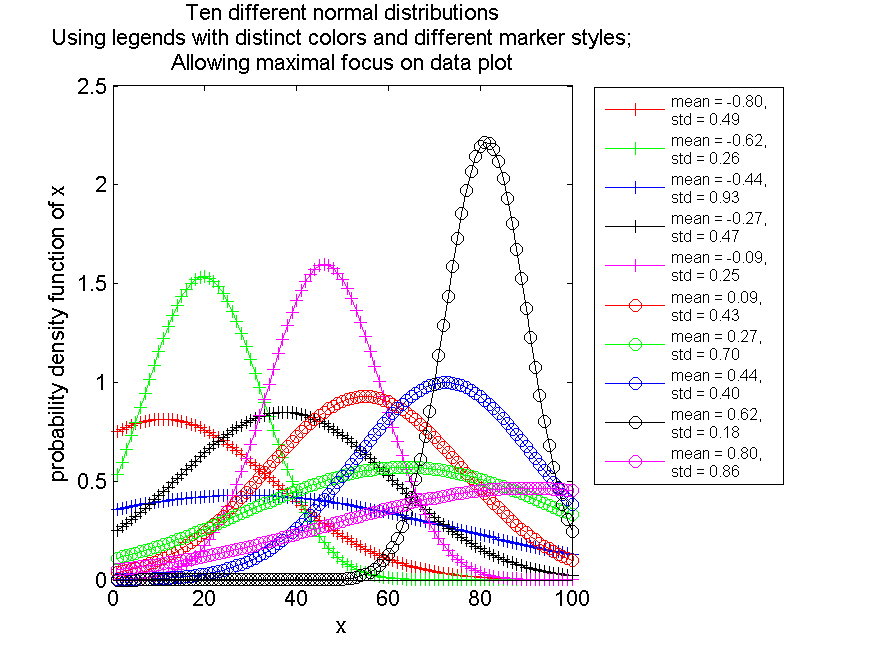
同时添加新线条表明指定分布,
for i = 1:10
    dataVect(i,:) = (1/sqrt(2*pi*stdVect(i).^2))*exp(-(x-meanVect(i)).^2/(2*stdVect(i).^2)); % Gaussian function
    plot(dataVect(i,:), LineSpecs{i});
    legendMatrix{i} = [sprintf('mean = %.2f, ',meanVect(i)) char(10) sprintf('std = %.2f',stdVect(i))];
end
legend(legendMatrix,'Location','NorthEastOutside','Fontsize',8);
结果:


 6321
6321

 被折叠的 条评论
为什么被折叠?
被折叠的 条评论
为什么被折叠?
 到【灌水乐园】发言


