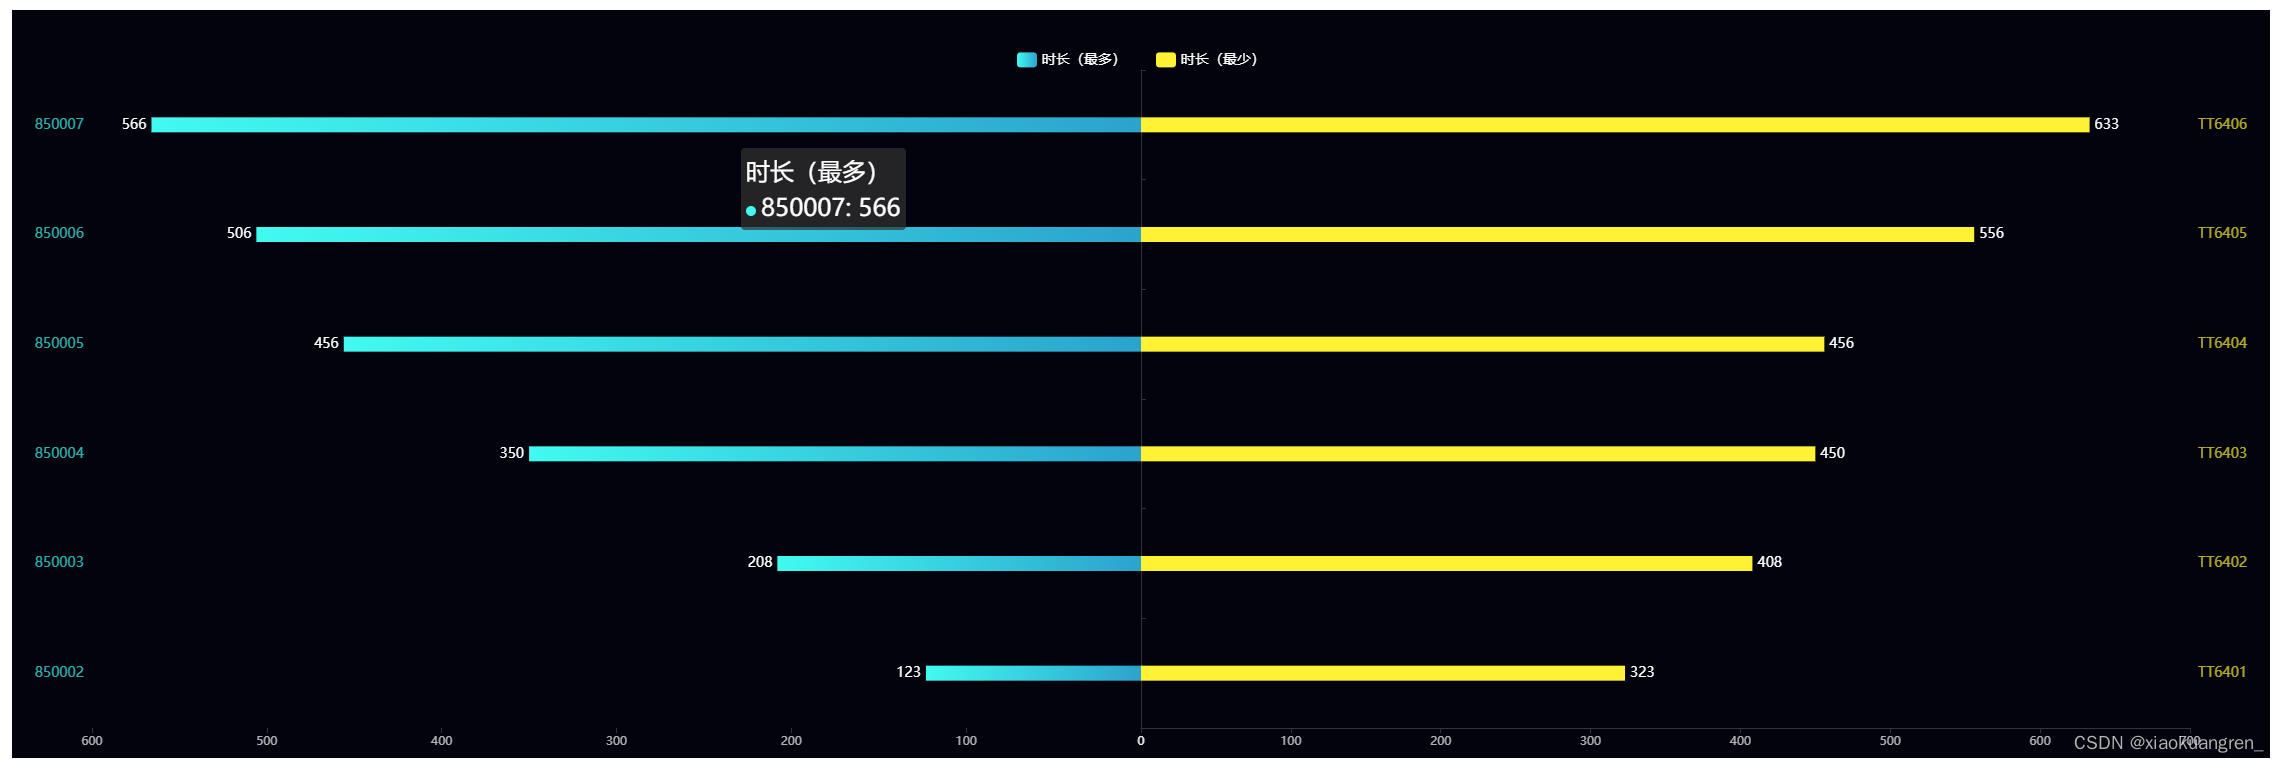
echarts
<template>
  <div style="width: 100%; height: 100%" ref="chart" v-loading="loading"></div>
</template>
<script>
export default {
  data () {
    return {
      chart: null,
      loading: false
    }
  },
  mounted () {
  },
  methods: {
    openLoading () {
      this.loading = true
    },
    closeLoading () {
      this.loading = false
    },
    drawEchart ({ nameData = [], leftData = [], leftLabel = [], rightData = [], rightLable = [] }) {
      var name = nameData
      var options = {
        backgroundColor: '#02030c',
        tooltip: {
          trigger: 'item',
          axisPointer: { // 坐标轴指示器,坐标轴触发有效
            type: 'line' // 默认为直线,可选为:'line' | 'shadow'
          },
          textStyle: {
            fontSize: 24
          }
        },
        'legend': {
          'left': 'center',
          'top': '5%',
          'show': true,
          'type': 'scroll',
          'data': name,
          'itemWidth': 20,
          'itemHeight': 15,
          'itemGap': 30,
          'textStyle': {
            'fontSize': 14,
            'color': '#fff',
            'fontFamily': 'Microsoft YaHei'
          }
        },
        'grid': [
          {
            'left': '80px',
            'right': '50%',
            'top': 60,
            'bottom': '30'
          }, {
            'left': '50%',
            'right': '80px',
            'top': 60,
            'bottom': '30'
          }],
        'xAxis': [
          {
            'type': 'value',
            'gridIndex': 0,
            'inverse': true,
            'axisLine': {
              'show': false
            },
            'splitLine': {
              'show': false
            },
            'axisTick': {
              'show': true
            },
            'axisLabel': {
              'show': true,
              'color': 'rgba(255,250,255,0.7)'
            },
            'data': []
          },
          {
            'type': 'value',
            'gridIndex': 1,
            'inverse': false,
            'axisLine': {
              'show': true
            },
            'splitLine': {
              'show': false
            },
            'axisTick': {
              'show': true
            },
            'axisLabel': {
              'show': true,
              'color': 'rgba(255,250,255,0.7)'
            },
            'data': []
          }],
        'yAxis': [
          {
            'type': 'category',
            // offset: -20,
            'axisLine': {
              'show': true
            },
            'splitLine': {
              'show': false
            },
            'axisTick': {
              'show': false
            },
            'axisLabel': {
              'show': true,
              'fontSize': 14,
              'color': 'rgba(65,250,240,0.7)'
            },
            'data': leftLabel,
            position: 'left'
          },
          {
            'type': 'category',
            // offset: -20,
            'gridIndex': 1,
            'axisLine': {
              'show': false
            },
            'splitLine': {
              'show': false
            },
            'axisTick': {
              'show': true
            },
            'axisLabel': {
              'show': true,
              'fontSize': 14,
              'color': 'rgba(265,242,53,0.7)'
            },
            'data': rightLable,
            position: 'right'

          }],
        'series': [
          {
            'colId': 'col402utokg',
            'name': name[0],
            'type': 'bar',
            'data': leftData,
            barWidth: 15,
            color: '#00f3df',
            'xAxisIndex': 0,
            'yAxisIndex': 0,
            itemStyle: {
              normal: {
                // barBorderRadius: [10, 10, 10, 10],
                color: new this.$echarts.graphic.LinearGradient(0, 0, 1, 0, [{
                  offset: 0,
                  color: 'rgba(65,250,240,1)'
                },
                {
                  offset: 1,
                  color: 'rgba(43,163,205,1)'
                }
                ])
              }
            },
            'label': {
              'position': 'left',
              'fontFamily': 'Microsoft YaHei',
              'show': true,
              'fontSize': 14,
              'color': '#fff'
            }
          },
          {
            'colId': 'col3kkgr6h9',
            'name': name[1],
            'type': 'bar',
            'data': rightData,
            barWidth: 15,
            color: '#01b3e0',
            'xAxisIndex': 1,
            'yAxisIndex': 1,
            itemStyle: {
              normal: {
                // barBorderRadius: [10, 10, 10, 10],
                color: new this.$echarts.graphic.LinearGradient(1, 0, 0, 0, [{
                  offset: 0,
                  color: 'rgba(265,242,53,1)'
                },
                {
                  offset: 1,
                  color: 'rgba(265,242,53,1)'
                }
                ])
              }
            },
            'label': {
              'position': 'right',
              'fontFamily': 'Microsoft YaHei',
              'show': true,
              'fontSize': 14,
              'color': '#fff'
            }
          }]
      }
      this.chart = this.$echarts.init(this.$refs.chart)
      this.chart.setOption(options)
    }
  }
}
</script>
<style lang="scss" scoped>
</style>


 4634
4634


 被折叠的 条评论
为什么被折叠?


