


安装库
pip install numpy
pip install scipy
pip install matplotlib
import numpy as np
import matplotlib.pyplot as plt

x = np.linspace(0, 10, 100)
y = np.sin(x) + 1
z = np.cos(x**2) + 1

plt.figure(figsize = (8, 4))
plt.plot(x, z, 'b--', label = '$\cos x^2+1$')
plt.xlabel('Time(s)')
plt.ylabel('Volt')
plt.title('A siple Example')
plt.ylim(0, 22)
plt.legend()
plt.show()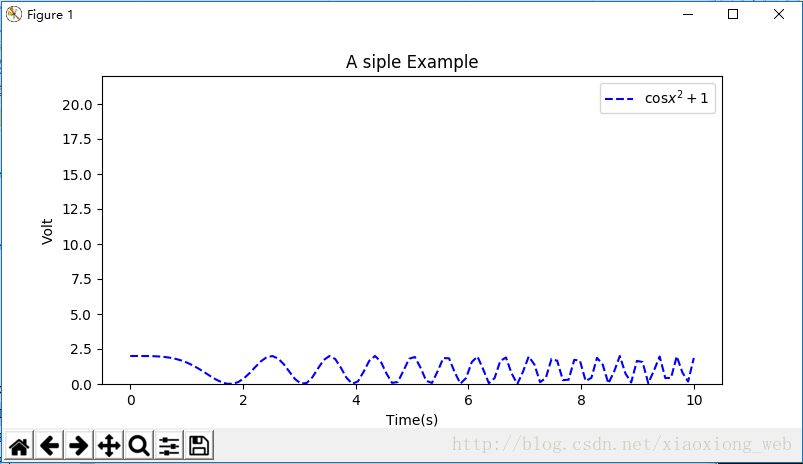
上面图表中文无法显示,需要指定一下中文字体库就好了。下面是完整代码。
import numpy as np
import matplotlib
import matplotlib.pyplot as plt

zhfont1 = matplotlib.font_manager.FontProperties(fname='C:\Windows\Fonts\simsun.ttc')

x = np.linspace(0, 10, 100)
y = np.sin(x) + 1
z = np.cos(x**2) + 1

plt.figure(figsize = (8, 4))


plt.plot(x, z, 'b--', label = '$\cos x^2+1$')
plt.xlabel('Time(s)')
plt.ylabel('简单',fontproperties=zhfont1)
plt.title(u'一个简单的例子',fontproperties=zhfont1)
plt.ylim(0, 22)
plt.legend()
plt.show()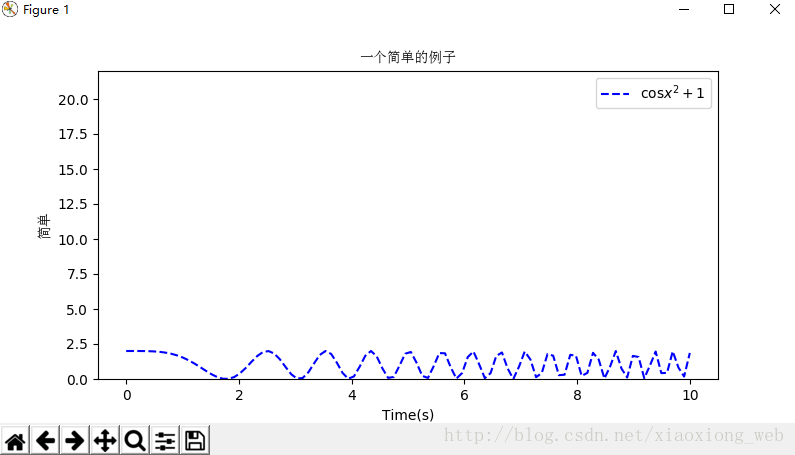


 4070
4070


 被折叠的 条评论
为什么被折叠?
被折叠的 条评论
为什么被折叠?
 到【灌水乐园】发言


