


Chart.js 是一个灵活且功能强大的 JavaScript 库,可轻松创建各种类型的图表。在本指南中,我们将逐步介绍如何将 Chart.js 与 AngularJS 集成,并使用示例财务数据创建不同类型的图表。
一.先决条件
在我们开始之前,请确保您已准备好以下内容。
- 已安装 Node.js
- 您的项目中包含 AngularJS 库
二.使用
步骤 1. 设置 AngularJS 项目
如果您没有现有的 AngularJS 项目,请创建一个新项目。确保在项目中包含 AngularJS 和 Chart.js 库。
您可以在 HTML 文件中包括 AngularJS 和 Chart.js,如下所示。
<!DOCTYPE html>
<html ng-app="chartApp">
<head>
<title>Chart.js with AngularJS</title>
<script src="https://ajax.googleapis.com/ajax/libs/angularjs/1.8.2/angular.min.js"></script>
<script src="https://cdn.jsdelivr.net/npm/chart.js"></script>
</head>
<body>
<div ng-controller="ChartController as ctrl">
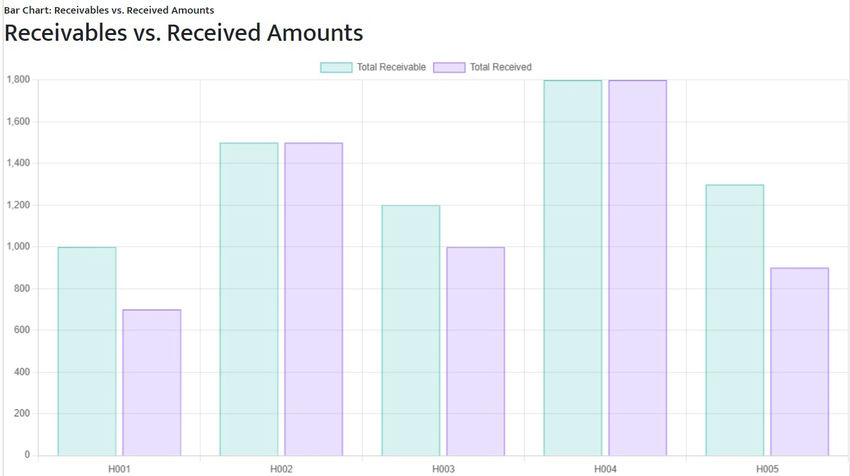
<!-- Bar Chart: Receivables vs. Received Amounts -->
<h2>Receivables vs. Received Amounts</h2>
<canvas id="receivablesVsReceivedChart" width="400" height="200"></canvas>
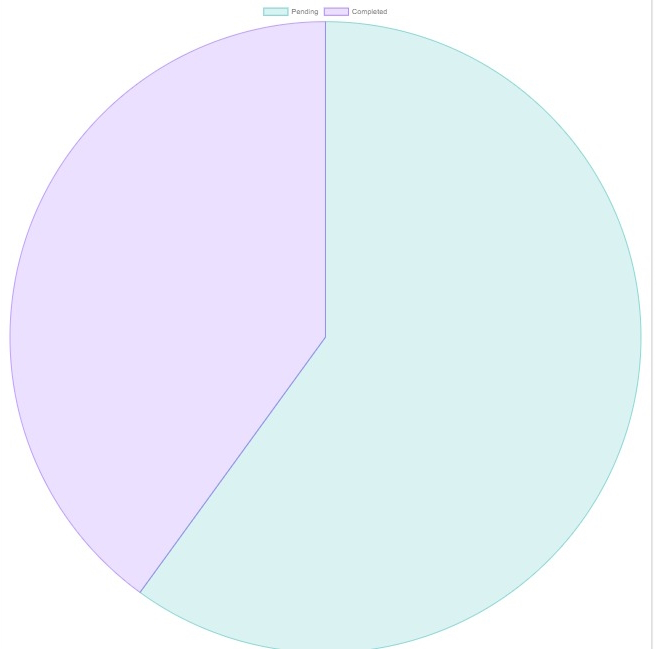
<!-- Pie Chart: Payment Status Distribution -->
<h2>Payment Status Distribution</h2>
<canvas id="paymentStatusChart" width="400" height="200"></canvas>
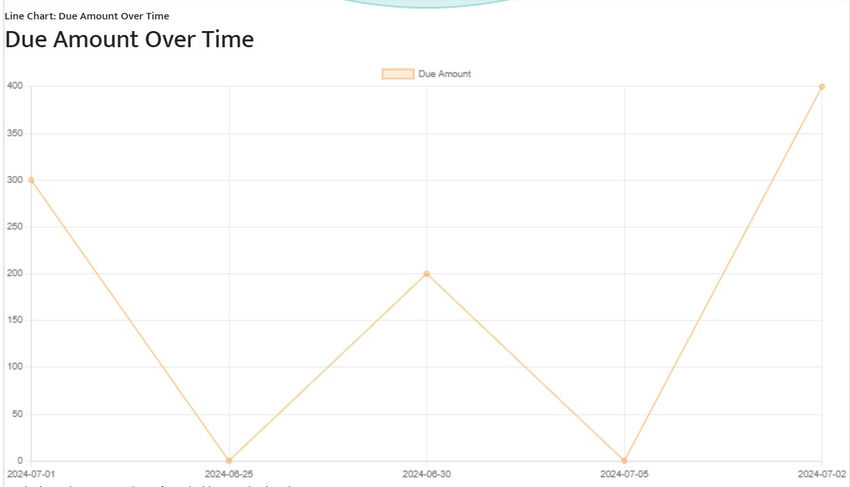
<!-- Line Chart: Due Amount Over Time -->
<h2>Due Amount Over Time</h2>
<canvas id="dueAmountOverTimeChart" width="400" height="200"></canvas>
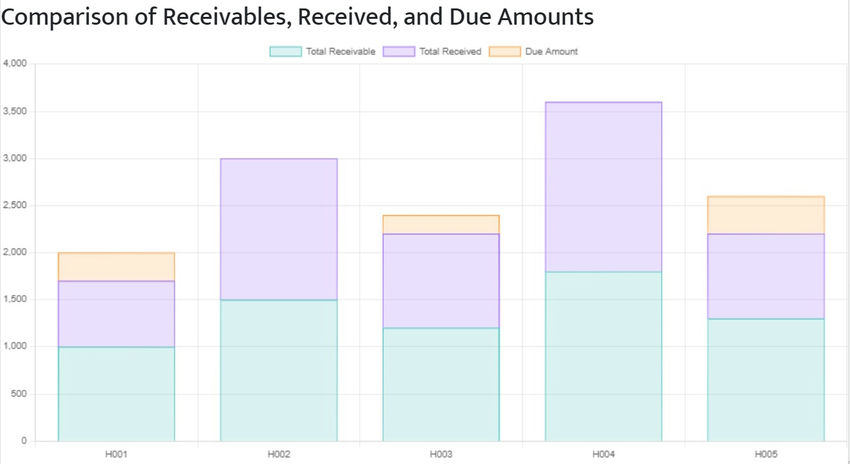
<!-- Stacked Bar Chart: Comparison of Receivables, Received, and Due Amounts -->
<h2>Comparison of Receivables, Received, and Due Amounts</h2>
<canvas id="stackedBarChart" width="400" height="200"></canvas>
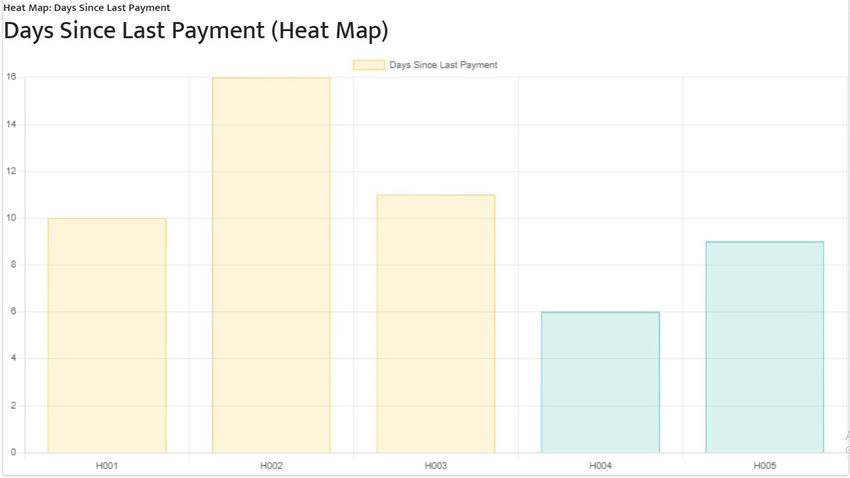
<!-- Heat Map: Days Since Last Payment -->
<h2>Days Since Last Payment (Heat Map)</h2>
<canvas id="heatMapChart" width="400" height="200"></canvas>
</div>
<script src="app.js"></script>
</body>
</html>
步骤 2.创建 AngularJS 控制器
在您的 app.js 中,创建一个 AngularJS 模块和一个控制器来处理图表:
angular.module('chartApp', [])
  .controller('ChartController', ['$scope', function($scope) {

    $scope.sampleData = [
      { hoseNo: 'H001', total_Receivable: 1000, total_Received: 700, due_Amount: 300, status: 'pending', last_Payment_Date: '2024-07-01', last_Payment_Days: 10 },
      { hoseNo: 'H002', total_Receivable: 1500, total_Received: 1500, due_Amount: 0, status: 'completed', last_Payment_Date: '2024-06-25', last_Payment_Days: 16 },
      { hoseNo: 'H003', total_Receivable: 1200, total_Received: 1000, due_Amount: 200, status: 'pending', last_Payment_Date: '2024-06-30', last_Payment_Days: 11 },
      { hoseNo: 'H004', total_Receivable: 1800, total_Received: 1800, due_Amount: 0, status: 'completed', last_Payment_Date: '2024-07-05', last_Payment_Days: 6 },
      { hoseNo: 'H005', total_Receivable: 1300, total_Received: 900, due_Amount: 400, status: 'pending', last_Payment_Date: '2024-07-02', last_Payment_Days: 9 }
    ];
    $scope.initCharts = function() {
      $scope.initBarChart();
      $scope.initPieChart();
      $scope.initLineChart();
      $scope.initStackedBarChart();
      $scope.initHeatMapChart();
    };
    $scope.initBarChart = function() {
      const ctx = document.getElementById('receivablesVsReceivedChart').getContext('2d');
      const labels = $scope.sampleData.map(item => item.hoseNo);
      const receivableData = $scope.sampleData.map(item => item.total_Receivable);
      const receivedData = $scope.sampleData.map(item => item.total_Received);
      new Chart(ctx, {
        type: 'bar',
        data: {
          labels: labels,
          datasets: [
            {
              label: 'Total Receivable',
              data: receivableData,
              backgroundColor: 'rgba(75, 192, 192, 0.2)',
              borderColor: 'rgba(75, 192, 192, 1)',
              borderWidth: 1
            },
            {
              label: 'Total Received',
              data: receivedData,
              backgroundColor: 'rgba(153, 102, 255, 0.2)',
              borderColor: 'rgba(153, 102, 255, 1)',
              borderWidth: 1
            }
          ]
        },
        options: {
          scales: {
            y: {
              beginAtZero: true
            }
          }
        }
      });
    };
    $scope.initPieChart = function() {
      const ctx = document.getElementById('paymentStatusChart').getContext('2d');
      const pendingCount = $scope.sampleData.filter(item => item.status === 'pending').length;
      const completedCount = $scope.sampleData.filter(item => item.status === 'completed').length;
      new Chart(ctx, {
        type: 'pie',
        data: {
          labels: ['Pending', 'Completed'],
          datasets: [{
            data: [pendingCount, completedCount],
            backgroundColor: ['rgba(75, 192, 192, 0.2)', 'rgba(153, 102, 255, 0.2)'],
            borderColor: ['rgba(75, 192, 192, 1)', 'rgba(153, 102, 255, 1)'],
            borderWidth: 1
          }]
        }
      });
    };
    $scope.initLineChart = function() {
      const ctx = document.getElementById('dueAmountOverTimeChart').getContext('2d');
      const labels = $scope.sampleData.map(item => item.last_Payment_Date);
      const dueAmountData = $scope.sampleData.map(item => item.due_Amount);
      new Chart(ctx, {
        type: 'line',
        data: {
          labels: labels,
          datasets: [{
            label: 'Due Amount',
            data: dueAmountData,
            backgroundColor: 'rgba(255, 159, 64, 0.2)',
            borderColor: 'rgba(255, 159, 64, 1)',
            borderWidth: 1
          }]
        },
        options: {
          scales: {
            y: {
              beginAtZero: true
            }
          }
        }
      });
    };
    $scope.initStackedBarChart = function() {
      const ctx = document.getElementById('stackedBarChart').getContext('2d');
      const labels = $scope.sampleData.map(item => item.hoseNo);
      const receivableData = $scope.sampleData.map(item => item.total_Receivable);
      const receivedData = $scope.sampleData.map(item => item.total_Received);
      const dueAmountData = $scope.sampleData.map(item => item.due_Amount);
      new Chart(ctx, {
        type: 'bar',
        data: {
          labels: labels,
          datasets: [
            {
              label: 'Total Receivable',
              data: receivableData,
              backgroundColor: 'rgba(75, 192, 192, 0.2)',
              borderColor: 'rgba(75, 192, 192, 1)',
              borderWidth: 1
            },
            {
              label: 'Total Received',
              data: receivedData,
              backgroundColor: 'rgba(153, 102, 255, 0.2)',
              borderColor: 'rgba(153, 102, 255, 1)',
              borderWidth: 1
            },
            {
              label: 'Due Amount',
              data: dueAmountData,
              backgroundColor: 'rgba(255, 159, 64, 0.2)',
              borderColor: 'rgba(255, 159, 64, 1)',
              borderWidth: 1
            }
          ]
        },
        options: {
          scales: {
            x: {
              stacked: true
            },
            y: {
              stacked: true,
              beginAtZero: true
            }
          }
        }
      });
    };
    $scope.initHeatMapChart = function() {
      const ctx = document.getElementById('heatMapChart').getContext('2d');
      const labels = $scope.sampleData.map(item => item.hoseNo);
      const paymentDaysData = $scope.sampleData.map(item => item.last_Payment_Days);
      const colors = $scope.sampleData.map(item => {
        if (item.last_Payment_Days < 10) return 'rgba(75, 192, 192, 0.2)';
        if (item.last_Payment_Days < 20) return 'rgba(255, 205, 86, 0.2)';
        return 'rgba(255, 99, 132, 0.2)';
      });
      new Chart(ctx, {
        type: 'bar',
        data: {
          labels: labels,
          datasets: [{
            label: 'Days Since Last Payment',
            data: paymentDaysData,
            backgroundColor: colors,
            borderColor: colors.map(color => color.replace('0.2', '1')),
            borderWidth: 1
          }]
        },
        options: {
          scales: {
            y: {
              beginAtZero: true
            }
          }
        }
      });
    };
    $scope.initCharts();
  }]);
步骤 3.添加样式
您可以添加样式来自定义图表的外观。将以下 CSS 添加到您的项目中:
canvas {
  display: block;
  margin: 0 auto;
}
步骤 4.运行应用程序
在 Web 浏览器中打开 index.html 文件。您应该会看到随示例数据显示的不同类型的图表。
三.结论
通过遵循这些步骤,您可以将 Chart.js 集成到 AngularJS 应用程序中,并创建各种类型的图表来可视化您的数据。Chart.js 提供了一种强大而灵活的方式来使用交互式且视觉上有吸引力的图表来增强您的 Web 应用程序。


 被折叠的 条评论
为什么被折叠?
被折叠的 条评论
为什么被折叠?
 到【灌水乐园】发言


