


Echarts柱状图配置
1. 单个柱子自定义圆角
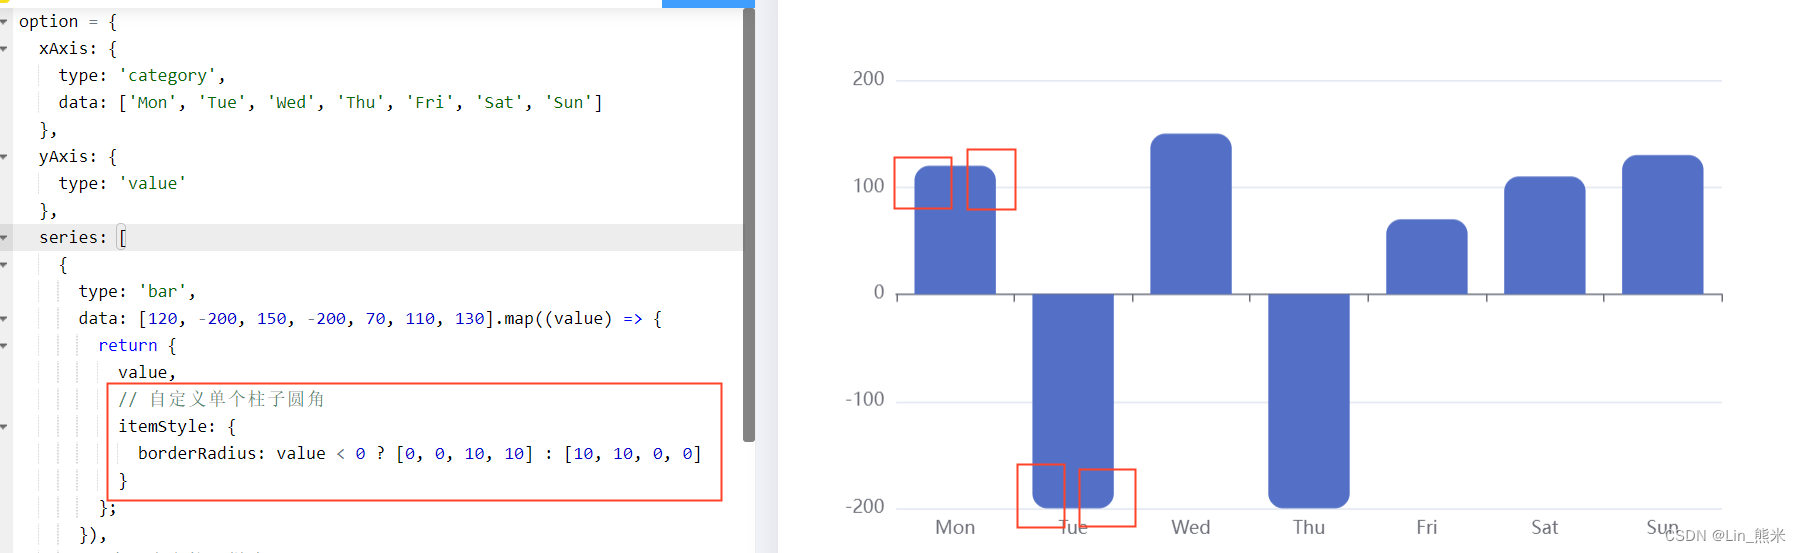
Echarts bar 系列提供了改变单个柱子的配置属性 series-bar.data.itemStyle,通过 borderRadius 可以调整柱子圆角半径。
// series-bar.data.itemStyle
// 自定义单个柱子圆角
itemStyle: {
  borderRadius: value < 0 ? [0, 0, 10, 10] : [10, 10, 0, 0]
}
效果如图:
2. 定义柱子渐变颜色
Echarts bar 系列提供了全局定义柱子样式的配置属性 series-bar.itemStyle,通过 color 可以全局定义柱子渐变颜色。
// series-bar.itemStyle.color
// 全局定义柱子样式
itemStyle: {
  color: {
    type: 'linear',
    // x,y渐变起点位置
    x: 0,
    y: 0,
    // x2, y2 渐变终点位置
    x2: 0,
    y2: 1,
    colorStops: [
      { offset: 0, color: 'yellow' }, // 0% 处的颜色
      { offset: 1, color: 'red' } // 100% 处的颜色
    ]
  }
}
效果如图:

完整代码
option = {
  xAxis: {
    type: 'category',
    data: ['Mon', 'Tue', 'Wed', 'Thu', 'Fri', 'Sat', 'Sun']
  },
  yAxis: {
    type: 'value'
  },
  series: [
    {
      type: 'bar',
      data: [120, -200, 150, -200, 70, 110, 130].map((value) => {
        return {
          value,
          // 自定义单个柱子圆角
          itemStyle: {
            borderRadius: value < 0 ? [0, 0, 10, 10] : [10, 10, 0, 0]
          }
        };
      }),
      // 全局定义柱子样式
      itemStyle: {
        color: {
          type: 'linear',
          // x,y渐变起点位置
          x: 0,
          y: 0,
          // x2, y2 渐变终点位置
          x2: 0,
          y2: 1,
          colorStops: [
            { offset: 0, color: 'yellow' }, // 0% 处的颜色
            { offset: 1, color: 'red' } // 100% 处的颜色
          ]
        }
      }
    }
  ]
};


 6万+
6万+


 被折叠的 条评论
为什么被折叠?
被折叠的 条评论
为什么被折叠?
 到【灌水乐园】发言


