


 本文介绍了如何通过ELK Stack(Elasticsearch、Logstash、Kibana)收集和展示Nginx的JSON格式日志。首先,修改Nginx配置以生成JSON格式日志,然后配置Filebeat读取这些日志,并通过Redis发送到Logstash。Logstash进一步处理日志并将其存储到Elasticsearch。最后,在Kibana中创建索引以可视化日志数据。
ELK收集Nginx(json格式)并进行展示
一、背景描述
生产环境部署有elk环境,收集日志流程:filebeat -- > redis --> logstash --> elasticsearch --> kibana。
注:环境安装可以自行百度,这里直接讲解收集nginx日志到elk。
二、配置Nginx
①、设置Nginx 日志收集格式
Nginx日志格式设置
以收集Nginx访问日志为例,我们希望能统计到api接口调用排行,浏览器类型,操作系统类型,http状态分布,响应时间分布。虽然logstash可以通过內建模板解析Nginx日志字符串,不过直接在Nginx配置中直接json字符串最为方便。
nginx 的日志里含有中文的话,会将中文转为 Unicode 编码,如果不转的话,加入 escape=json 参数就可以了
修改nginx.conf 文件,将日志格式添加进去。
    log_format  access_json  escape=json   '{"@timestamp": "$time_iso8601", '
                               '"time": "$time_iso8601", '
                               '"remote_addr": "$remote_addr", '
                               '"remote_user": "$remote_user", '
                               '"request_uri":"$request_uri",'
                               '"request_time": "$request_time", '
                               '"upstream_time":"$upstream_response_time", '
                               '"upstream_addr": "$upstream_addr", '
                               '"upstream_status": $upstream_status, '
                               '"request_method": "$request_method", '
                               '"http_referrer": "$http_referer", '
                               '"body_bytes_sent": "$body_bytes_sent", '
                               '"status": $status, '
                               '"server_name": "$server_name", '
                               '"request_protocol": "$server_protocol", '
                               '"host": "$host", '
                               '"args":"$args", '
                               '"uri": "$uri", '
                               '"server_ip":"$server_addr", '
                               '"https":"$https", '
                               '"http_x_forwarded_for": "$http_x_forwarded_for", '
                               '"http_user_agent": "$http_user_agent"'
                               '}';
②、设置vhost下的站点配置文件
访问日志记录格式,设置为 access_json
access_log /usr/local/nginx/logs/elk_443.log access_json;③、检查nginx配置并重新加载配置文件
/usr/local/nginx/sbin/nginx -t
/usr/local/nginx/sbin/nginx -s reload
三、设置filebeat
①、采用rpm格式安装filebeat
下载地址:https://www.elastic.co/cn/downloads/beats/filebeat
https://artifacts.elastic.co/downloads/beats/filebeat/filebeat-7.11.1-x86_64.rpm
②、安装filebeat
rpm -ivh filebeat-7.11.1-x86_64.rpm③、配置filebeat.yml 文件
[root@nginx filebeat]# cat filebeat.yml
filebeat.inputs:
- type: log
  enabled: true
  paths:
  - "/usr/local/nginx/logs/elk_443.log"
  fields:
    log_source: elk_nginx
   ##添加这两行信息,使其能解析json格式的日志
  json.keys_under_root: true
  json.overwrite_keys: true

output.redis:
        hosts: ["10.20.11.40:6379"]
        password: "*******"
        key : "elk_redis"
        data_type : "list"
        db : 2
④、配置logstash
[root@logstash conf.d]# cat elk_nginx.conf
# Sample Logstash configuration for creating a simple
# Beats -> Logstash -> Elasticsearch pipeline.
input {
redis {
host => "10.20.11.40"
port => "6379"
password => "*******"
key => "elk_redis"
data_type => "list"
db => "2"
}
}
filter {
}
output {
# 根据redis键 messages_secure 对应的列表值中,每一行数据的其中一个参数来判断日志来源
if [fields][log_source] == 'elk_nginx' {
elasticsearch {
hosts => ["10.20.11.40:9200","10.20.11.41:9200","10.20.11.42:9200"]
index => "elk_nginx-%{+YYYY.MM.dd}"
user => "elastic"
password => "************"
}
}
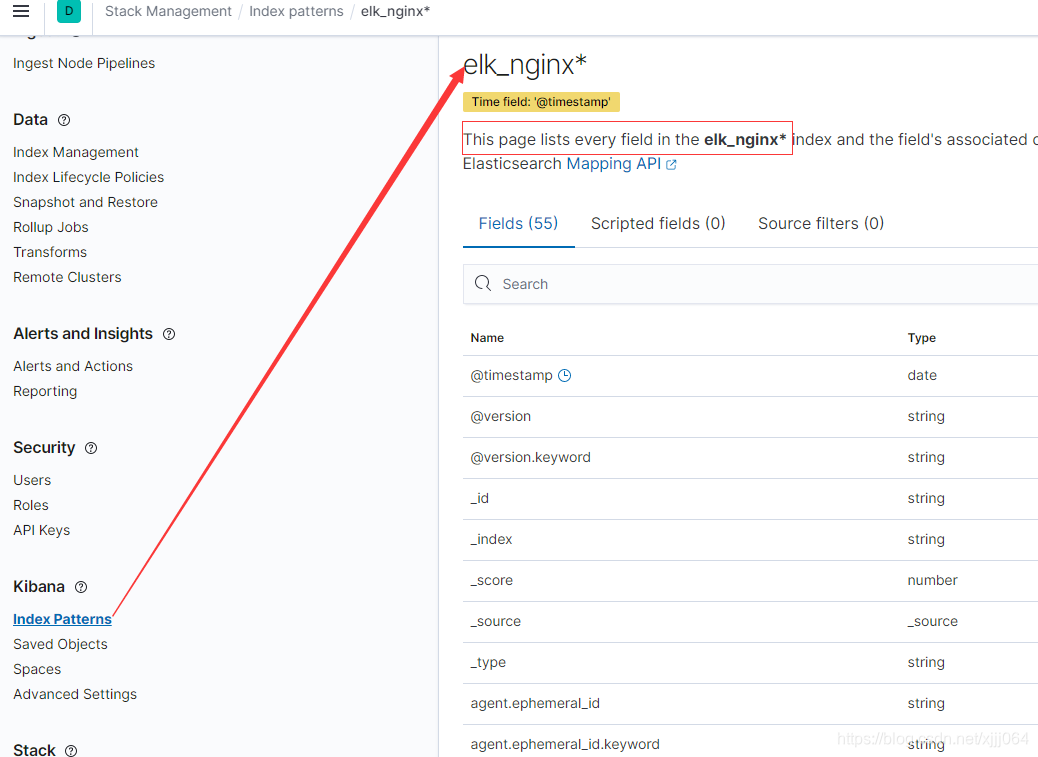
}⑤、登录kibana创建索引
截图为已建好索引
⑥、查看索引日志
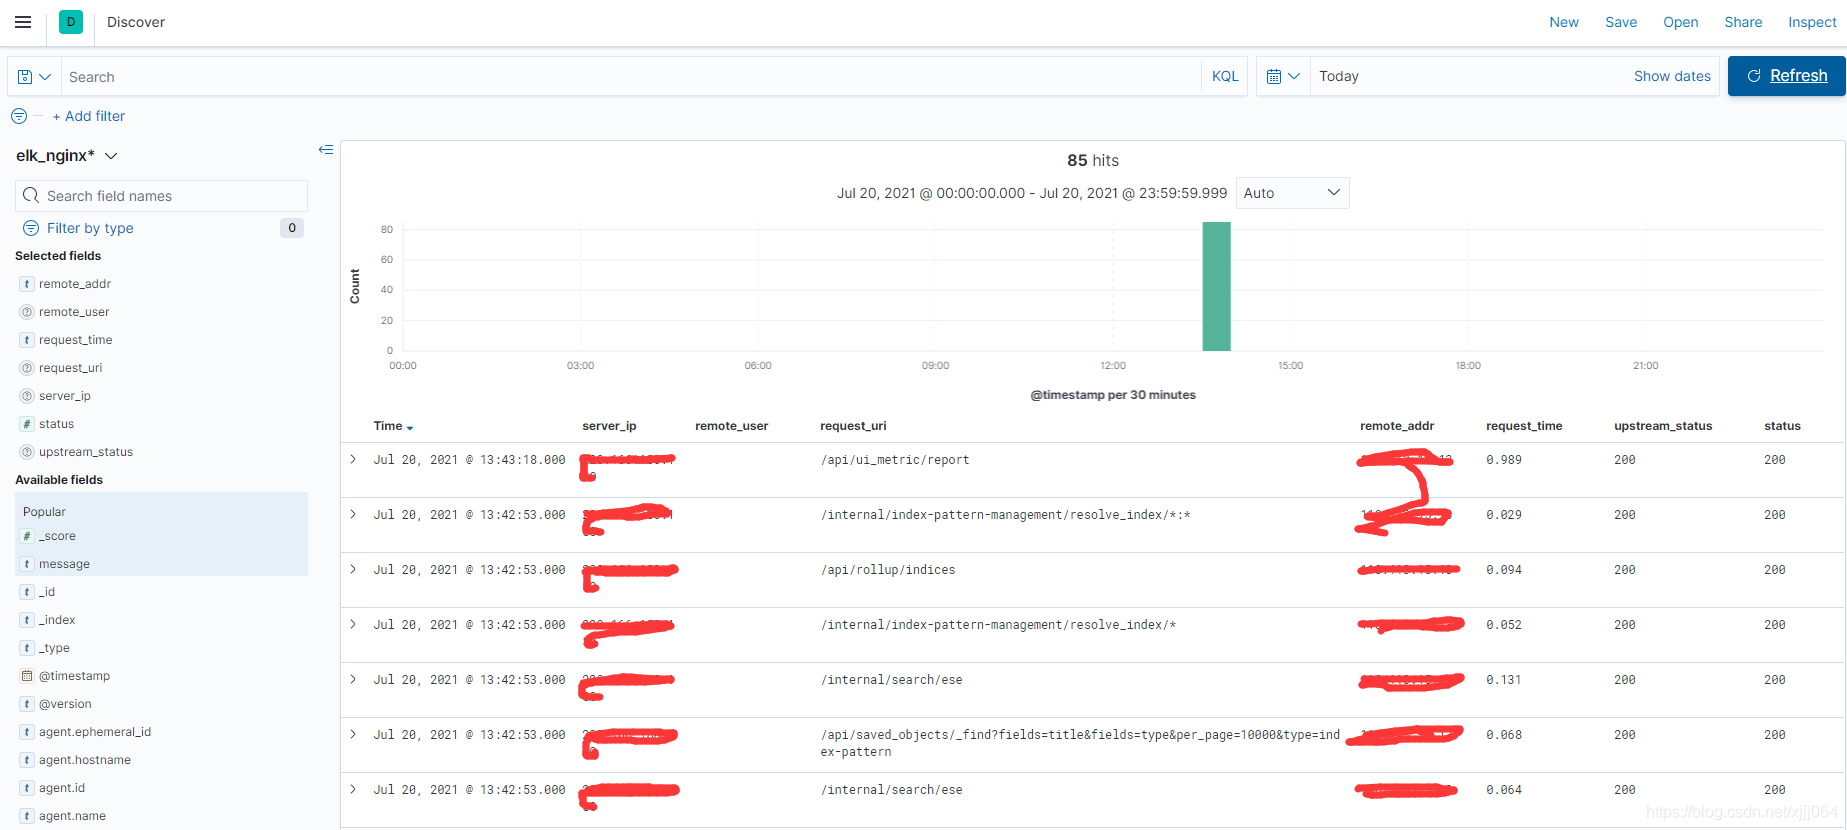
以上,Nginx日志收集就好了。
后续:使用图形化展示分析Nginx日志。


 1050
1050

 被折叠的 条评论
为什么被折叠?
被折叠的 条评论
为什么被折叠?
 到【灌水乐园】发言


