


1、下载并安装适合自己Python的numpy安装包
numpy : http://sourceforge.net/projects/numpy/files/NumPy/1.7.1/
2、下载并安装matplotlib
matplotlib : http://www.lfd.uci.edu/~gohlke/pythonlibs/#matplotlib
3、点击按钮实现画一个正弦波
from Tkinter import *
import matplotlib.pyplot as plt
import numpy as np
def draw_sin():
#draw a circle of sin
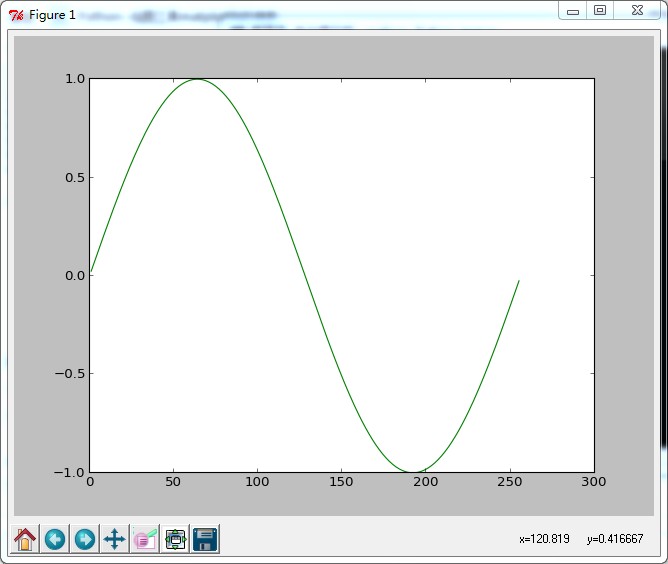
t = np.arange(1,256,1)
y = np.sin(2*np.pi*t/256)
plt.plot(t,y,'g')
plt.show()
root = Tk(className = 'DrawSin')
label = Label(root)
label['text'] = 'Draw Sin'
label.pack()
button = Button(root)
button['text'] = 'Draw'
button['command'] = draw_sin
button.pack()
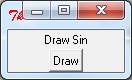
root.mainloop()效果
显示主菜单
点击按钮实现画图
4、点击按钮实现波形的变化
#!usr/bin/env/python
#coding=utf-8
from Tkinter import *
import matplotlib.pyplot as plt
import numpy as np
import sys
#number of point
Number = 1024
#init frequency value
frequency = 1
#set the recur depth
sys.setrecursionlimit(1000000)
def draw_sin():
'''raw a circle of sin'''
#generate the time base
t = np.arange(1,Number,1)
#generate the signal
y = np.sin(2*np.pi*frequency*t/Number)
plt.plot(t,y)
plt.grid(True)
plt.text(900,0.75,'Frequency is '+str(frequency))
plt.show()
def frequency_plus():
'''function of add the frequency and plot the signal'''
#notice:frequency is a global variable
global frequency
frequency = frequency + 1
#clear a figure window
plt.clf()
draw_sin()
def my_button(root,label_text,button_text,button_func):
'''function of creat label and button'''
#label details
label = Label(root)
label['text'] = label_text
label.pack()
#label details
button = Button(root)
button['text'] = button_text
button['command'] = button_func
button.pack()
def main():
'''main function'''
root = Tk(className = 'DrawSin')
#draw button function
my_button(root,'Draw sin','click to Draw',draw_sin)
#frequency plus function
my_button(root,'Freq Plus','click to Plus',frequency_plus)
root.mainloop()
if __name__ == "__main__":
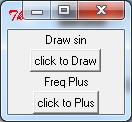
main()效果
显示主菜单
点击按钮实现频率改变

5、可能出现的问题
RuntimeError: maximum recursion depth exceeded
解决方法:
http://blog.csdn.net/lmh12506/article/details/7865288
网上学习资料:
m
http://wenku.baidu.com/view/dcee911cfad6195f312ba61c.html
python使用matplotlib绘图
http://www.cnblogs.com/qianlifeng/archive/2012/02/13/2350086.html


 1099
1099

 被折叠的 条评论
为什么被折叠?
被折叠的 条评论
为什么被折叠?
 到【灌水乐园】发言


