


echarts模块的导入
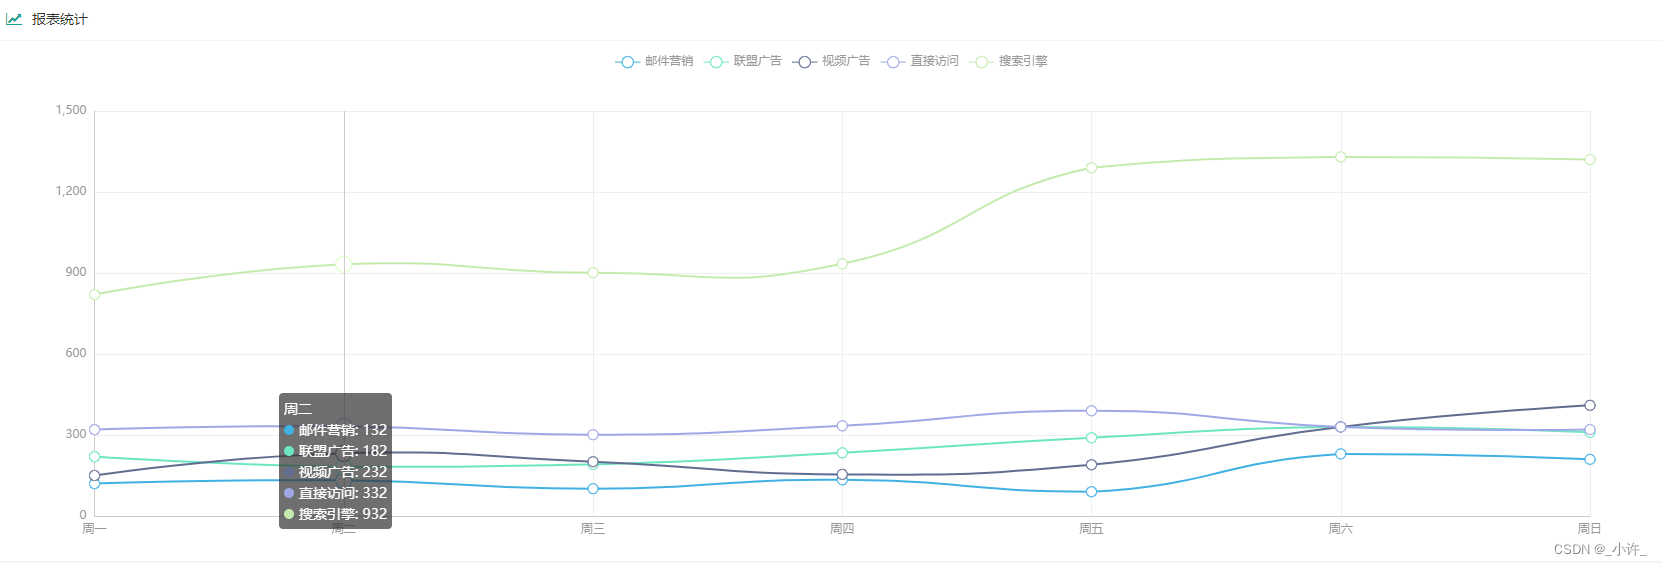
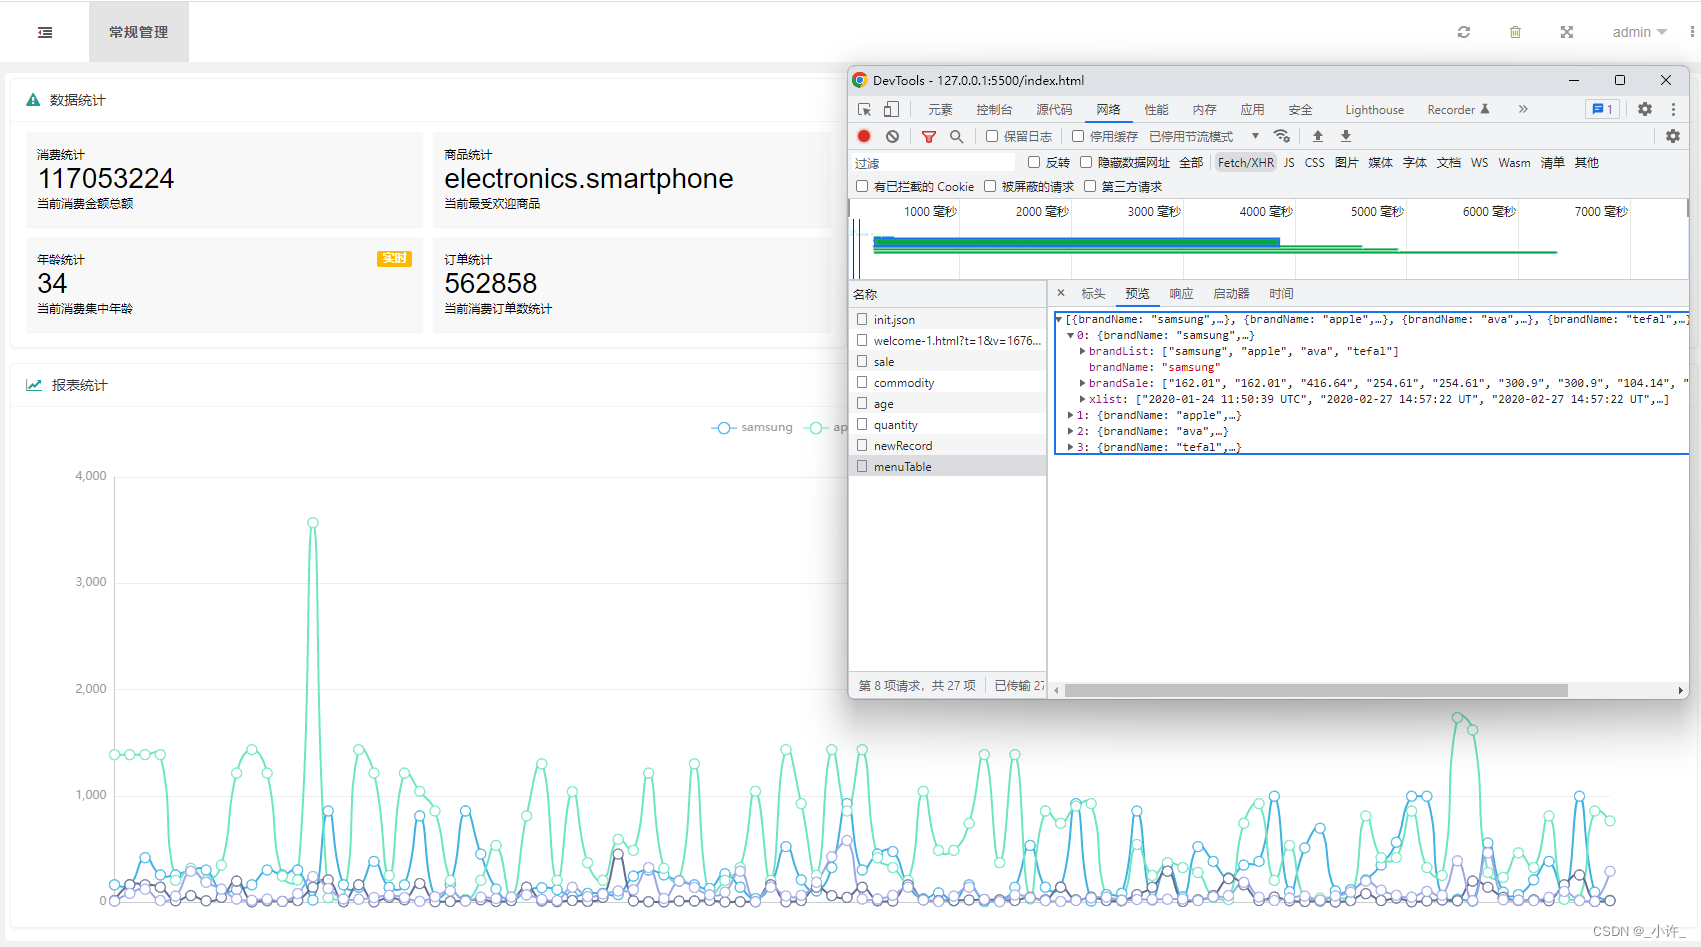
先看看成品吧!

有的图标的数据用了一些计算框架不是直接查数据库所以有点慢。
ok!😃 上正文,接上节Spring boot项目开发实战——(LayUI实现前后端数据交换与定义方法渲染数据)讲解了一般的单个数据的填充,和前端模板layui.laytpl的使用LayUI模板引擎渲染数据,本节将介绍echarts的使用。
layui.use(['layer','echarts','jquery','laytpl'], function () {
    var $ = layui.$,   //jQuery复制
        layer = layui.layer,
        echarts = layui.echarts,
        laytpl = layui.laytpl;
});
注意在使用echart需要配置echart为layui的内部组件,遵循layui的模块化原则。
还不知道如何引入请移步layui 使用 echarts感谢作者!
//初始化容器
var echartsRecords = echarts.init(document.getElementById('echarts-records'), 'walden');
//设置option填入数据
var optionRecords = {
    tooltip: {
        trigger: 'axis'
    },
    legend: {
        data: ['邮件营销', '联盟广告', '视频广告', '直接访问', '搜索引擎']
    },
    grid: {
        left: '3%',
        right: '4%',
        bottom: '3%',
        containLabel: true
    },
    toolbox: {
        feature: {
            saveAsImage: {}
        }
    },
    xAxis: {
        type: 'category',
        boundaryGap: false,
        data: ['周一', '周二', '周三', '周四', '周五', '周六', '周日']
    },
    yAxis: {
        type: 'value'
    },
    series: [
        {
            name: '邮件营销',
            type: 'line',
            data: [120, 132, 101, 134, 90, 230, 210]
        },
        {
            name: '联盟广告',
            type: 'line',
            data: [220, 182, 191, 234, 290, 330, 310]
        },
        {
            name: '视频广告',
            type: 'line',
            data: [150, 232, 201, 154, 190, 330, 410]
        },
        {
            name: '直接访问',
            type: 'line',
            data: [320, 332, 301, 334, 390, 330, 320]
        },
        {
            name: '搜索引擎',
            type: 'line',
            data: [820, 932, 901, 934, 1290, 1330, 1320]
        }
    ]
};
//
echartsRecords.setOption(optionRecords);
要先选好echarts图标,关注于数据本身,后期接口返回数据匹配表格数据方便渲染。
下面是我的数据库文件,是个电子消费的数据集(有需要的可以私信我)
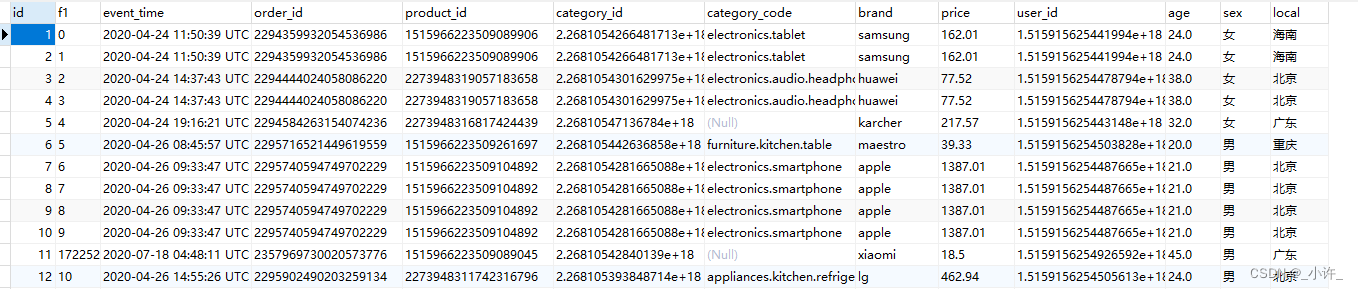
下面来看echarts的option,数据中中返回了5组字典和一个列表,如上图小编的数据库数据结构,这里将通过event_time和brand两个字段,计算最近一年销售最多的4个品牌,联系起来就应该返回4列表和一个时间列表,设计的model层对象如下:
public class MenuTableParam {
    private List<String> xList;

    /**
     * 品牌和销售数据
     */
    private String brandName;
    private List<String> brandSale;

}
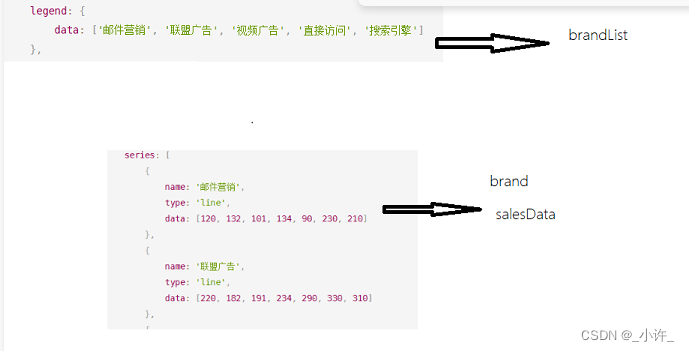
设计成这样的意义在于xList返回所有的品牌名,brandName字段返回单个品牌的销售数据,那么多个对象具有一样的数据直接用列表返回。
创建数据库表对象映射:(orm框架为mybatis-plus)
@Data
@TableName("productsales")
public class ProductSales {

    private Integer id;

    private String eventTime;
    private String orderId;
    private String productId;
    private String categoryId;
    private String categoryCode;
    private String brand;
    private Float price;
    private String userId;
    private Integer age;
    private String sex;
    private String local;
    private Long total;

}
mapper层查出品牌和时间信息,价格信息,返回最近一年的消费数据。查询数据库是均可用映射对象接收这样更方便。
 @Select("select brand,count(*) AS total from productsales GROUP BY brand ORDER BY total DESC")
 List<ProductSaleResult> getMenuTable();
接下来是服务层:服务层最重要的是如何返回最简单的数据,使控制器不用在过多处理,如下图:
@Service
public class MenuTableServiceImpl implements MenuTableService {

    @Autowired
    private ProductMapper productMapper;

    @Autowired
    private JavaSparkContext sc;

    @Override
    public List<MenuTableResult> getMenuTableResult() {
        //获取数据
        List<ProductSaleResult> menuTable = productMapper.getMenuTable();
        //取出前7名 防止出现空字符
        List<ProductSaleResult> productSaleResults = menuTable.subList(0, 8);
        //取出前四名获取最近一年数据
        List<String> brandList = new ArrayList<>();
        for (ProductSaleResult pr:productSaleResults
             ) {
            if (pr.getBrand() !=null && pr.getBrand() !=""){
                brandList.add(pr.getBrand());
            }
        }
        //取出4个季度
        List<String> newbrandList = brandList.subList(0,5);

        List<String> list = productMapper.itemList(newbrandList.get(0)).subList(0,99);
        List<String> list1 = productMapper.itemList(newbrandList.get(1)).subList(0,99);
        List<String> list2 = productMapper.itemList(newbrandList.get(2)).subList(0,99);
        List<String> list3 = productMapper.itemList(newbrandList.get(3)).subList(0,99);

        MenuTableResult result = new MenuTableResult();

        List<MenuTableResult> results = new ArrayList<>();

        MenuTableResult one = new MenuTableResult();
        one.setBrandName(newbrandList.get(0));
        one.setBrandSale(list);

        MenuTableResult two = new MenuTableResult();
        two.setBrandName(newbrandList.get(1));
        two.setBrandSale(list1);

        MenuTableResult three = new MenuTableResult();
        three.setBrandName(newbrandList.get(2));
        three.setBrandSale(list2);

        MenuTableResult four = new MenuTableResult();
        four.setBrandName(newbrandList.get(3));
        four.setBrandSale(list3);
        List<String> list4 = productMapper.timeList().subList(0, 99);

        one.setXList(list4);
        one.setBrandList(brandList.subList(0,4));

        results.add(one);results.add(two);results.add(three);results.add(four);

        return results;
    }
}
服务层使用spark的框架进行了一些计算,spark的使用会在后续更新出来,不要关注这个代码本身,这点直接掠过即可,要关注返回的数据的过程也就是构建4个
MenuTableResult。每个对象都会setBrandName和setBrandSale,最后用数组包裹就可以通过索引获取了。
service的数据构造也使controller控制器更为简单的返回:
@RestController
@RequestMapping("/product")
public class MenuTableController {

    @Autowired
    private MenuTableService menuTableService;
    @CrossOrigin
    @GetMapping("/menuTable")
    public List<MenuTableResult> getMenuTable(){
        List<MenuTableResult> menuTableResult = menuTableService.getMenuTableResult();
        return menuTableResult;
    }

}
如下返回的数据:
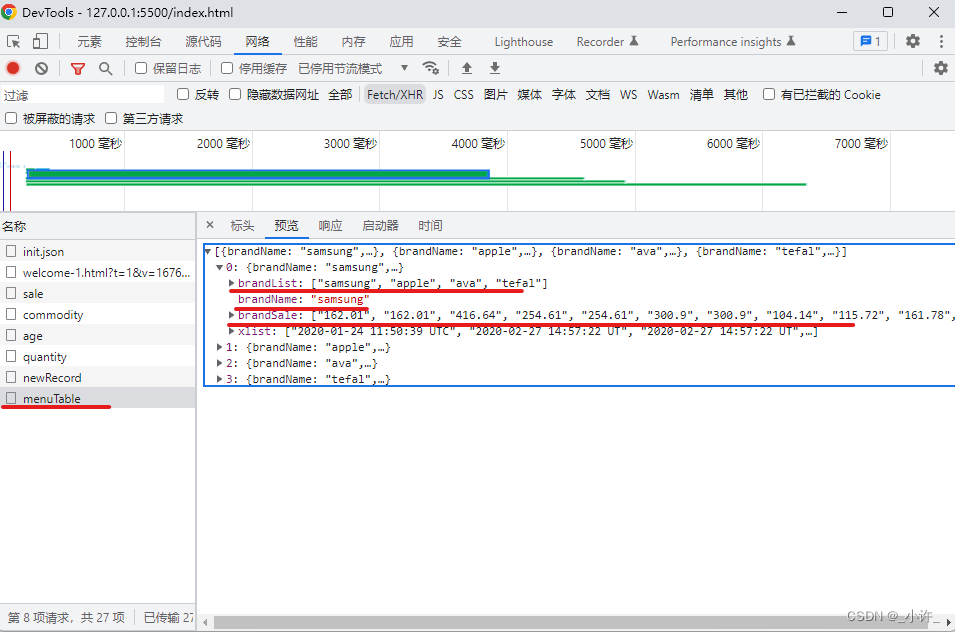
数据在经过上述构造后是的渲染更加容易
/**
 * 报表功能
 */
var echartsRecords = echarts.init(document.getElementById('echarts-records'), 'walden');
 $.ajax({
        type: "GET",
        url: "http://localhost:8080/product/menuTable",
        data: null,
        //dataType: "json",
        success: function (data) {
            //console.log(data)


            var optionRecords = {
                tooltip: {
                    trigger: 'axis'
                },
                legend: {
                    data: data[0].brandList
                },
                grid: {
                    left: '3%',
                    right: '4%',
                    bottom: '3%',
                    containLabel: true
                },
                toolbox: {
                    feature: {
                        saveAsImage: {}
                    }
                },
                xAxis: {
                    type: 'category',
                    boundaryGap: false,
                    data: data[0].xList
                },
                yAxis: {
                    type: 'value'
                },
                series: [
                    {
                        name: data[0].brandName,
                        type: 'line',
                        data: data[0].brandSale

                    },
                    {
                        name: data[1].brandName,
                        type: 'line',
                        data: data[1].brandSale
                    },
                    {
                        name: data[2].brandName,
                        type: 'line',
                        data: data[2].brandSale
                    },
                    {
                        name: data[3].brandName,
                        type: 'line',
                        data: data[3].brandSale
                    }
                ]
            };
            echartsRecords.setOption(optionRecords);

        }


    })
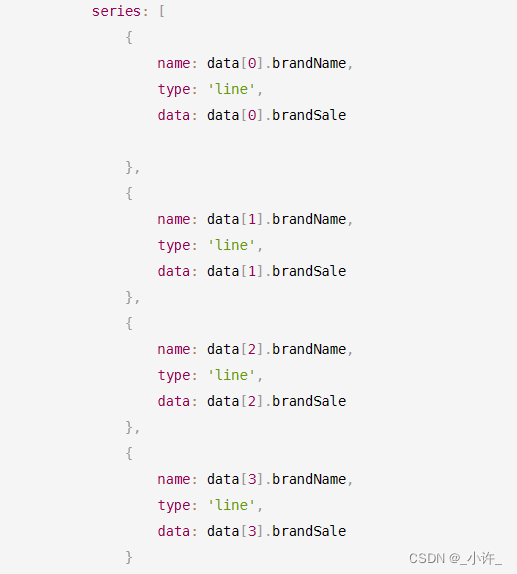
数据直接通过索引渲染到echarts图标上。


 3556
3556


 被折叠的 条评论
为什么被折叠?
被折叠的 条评论
为什么被折叠?
 到【灌水乐园】发言


