


layui项目,需要展现图表相关功能,官网默认使用的echarts图表库,但是免费下载的组件中,并不包含echarts组件,我们需要自己扩展组件。
去echarts下载 echarts.js,链接:
https://echarts.apache.org/handbook/zh/get-started/
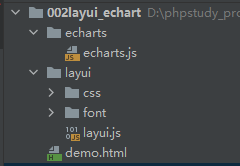
1.新建一个demo.html,并引入layui和echarts.js,如下图
引入layui包:
<link rel="stylesheet" href="layui/css/layui.css?v=1">
<!-- 引入 layui.js 的 <script> 标签最好放置在 html 末尾 -->
<script src="layui/layui.js"></script>
定义一个容器存放图表 需要指定这个容器的大小
<!-- 为 ECharts 准备一个定义了宽高的 DOM,必须定义宽高才可以显示 -->
<div style="width: 100%;height: 300px;" id="shopping"></div>
2.Echart 作为layui的内部组件使用 需要配置 配置后才可以使用
layui.config({
                version: 1,
                base: './echarts/' //这个就是你放echarts.js的目录
}).use(['element', 'echarts'], function() {

});
3.echarts.js 也需要配置
原头部为:

修改为:
(function (global, factory) {
    typeof exports === 'object' && typeof module !== 'undefined' ? factory(exports) :
        typeof define === 'function' && define.amd ? define(['exports'], factory) :
            window.layui && layui.define ? layui.define(function(exports){
                exports('echarts',factory(exports))}) :
                (factory((global.echarts = {})));
}(this, (function (exports) { 'use strict';
最下面尾部还需要加上 return exports;
否则在引用的时候会报错:Uncaught TypeError: Cannot read property 'init' of undefined

4.layui中使用:
<script type="text/javascript">
    layui.config({
        version: 1,
        base: 'echarts/' //这个就是你放Echart.js的目录
    }).use(['element', 'echarts', 'carousel'], function () {
        var element = layui.element,
            $ = layui.jquery,
            carousel = layui.carousel,
            echarts = layui.echarts;

        var shopping = echarts.init(document.getElementById('shopping'));

        // 指定图表的配置项和数据
        var optionShopping = {
            title: {
                text: '商品订单'
            },
            tooltip: {},
            legend: {
                data: ['销量']
            },
            xAxis: {
                data: ['衬衫', '羊毛衫', '雪纺衫', '裤子', '高跟鞋', '袜子']
            },
            yAxis: {type: 'value'},
            series: [
                {
                    name: '销量',
                    type: 'bar',//柱状
                    data: [5, 20, 36, 10, 10, 20],
                    itemStyle: {
                        normal: {//柱子颜色
                            color: '#4ad2ff'
                        }
                    }
                }
            ]
        };

        // 使用刚指定的配置项和数据显示图表。
        shopping.setOption(optionShopping);

    });


</script>
5.效果


 448
448


 被折叠的 条评论
为什么被折叠?
被折叠的 条评论
为什么被折叠?
 到【灌水乐园】发言


