


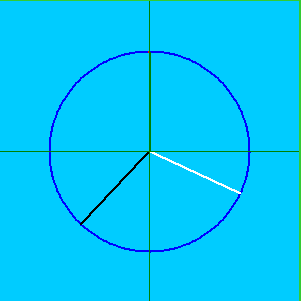
JavaScript绘制矢量图
在直角坐标系下旋转的矢量图效果
/*
 *创建异步访问对象
 */

 var beishu=[1,2,3,4,5,6,7,8,9,10];
 var refreshtime=2000;
 var temp=10;
 var pi=3.1415926;
 //  setInterval("vector_load()",1000);

function refresh_time()
{
   refreshtime=beishu[document.getElementById("refresh").value-1]*1000;

}

 function stop()
{
  if(document.getElementById("paus").value=="暂停")
    document.getElementById("paus").value="继续";
  else
    document.getElementById("paus").value="暂停";
}

   //辅助函数
     function $(id){return document.getElementById(id)};
    /**
    * 绘图对象
    * 包含各个绘图函数,比如画点,线段,多边形,圆等
    * 和一些绘图参数,比如背景颜色,画笔颜色
    **/
    var Plot = {
        //画布,所有被画出来的元素都append到这个container
      container: null,
      //原点x
      ox: 500,
      //原点y
      oy: 300,
      //坐标颜色
      baseLineColor: 'black',
      //画笔颜色
      brushColor: 'red',
      //画笔粗细
      brushWeight: 1,
      //baseLineX,baseLineY保存坐标线,用于坐标移位
      baseLineX: null,
      baseLineY: null,

      //初始化方法,设置画布,原点位置,坐标线颜色,画笔颜色,画笔粗细
      init: function(containerId, ox, oy, baseLineColor,brushColor,brushWeight){
        if($(containerId)){
          Plot.container = $(containerId);
        }
        else{
          alert('You should specify an element in which you can draw plot!');
          return;
        }
        if((typeof ox)=='number'){
          Plot.ox = ox;
        }
        if((typeof oy)=='number'){
          Plot.oy = oy;
        }
        Plot.baseLineColor = baseLineColor;
        Plot.brushColor = brushColor;
        Plot.brushWeight = brushWeight;
        Plot.drawCoordinate();
      },
      //设置原点函数
      setOPoint: function(ox,oy){
        Plot.ox = ox;
        Plot.oy = oy;
        Plot.container.removeChild(Plot.baseLineX);
        Plot.container.removeChild(Plot.baseLineY);
        Plot.drawCoordinate();
      },
      //设置画笔粗细函数
      setBrushWeight: function(weight){
        Plot.brushWeight = weight;
      },
      setBrushColor: function(color){
        Plot.brushColor = color;
      },
      //画坐标线
      drawCoordinate: function(){
        var baseLineX = document.createElement('div');
        baseLineX.style.position = "absolute";
        baseLineX.style.left = 0;
        baseLineX.style.top = Plot.oy;
        baseLineX.style.fontSize = '1px';
        baseLineX.style.height = '1px';
        baseLineX.style.width = '100%';
        baseLineX.style.overflow = 'hidden'
        baseLineX.style.backgroundColor = Plot.baseLineColor;
        Plot.container.appendChild(baseLineX);
        Plot.baseLineX = baseLineX;
        var baseLineY = document.createElement('div');
        baseLineY.style.position = "absolute";
        baseLineY.style.left = Plot.ox;
        baseLineY.style.top = 0;
        baseLineY.style.fontSize = '1px';
        baseLineY.style.height = '100%';
        baseLineY.style.width = '1px';
        baseLineY.style.overflow = 'hidden'
        baseLineY.style.backgroundColor = Plot.baseLineColor;
        Plot.baseLineY = baseLineY;
        Plot.container.appendChild(baseLineY);
      },
      //清理画布,移走所有对象
      clean: function(){
        Plot.container.innerHTML ="";
        Plot.drawCoordinate();
      },
      //画点,相对原点
      drawDot: function(x,y){
        var dot = document.createElement('div');
        dot.style.left = Plot.ox + x + 'px';
        dot.style.top = Plot.oy - y + 'px';
        dot.style.height = Plot.brushWeight;
        dot.style.width = Plot.brushWeight;
        dot.style.position = 'absolute';
        dot.style.fontSize = '1px';
        dot.style.backgroundColor = Plot.brushColor;
        dot.style.overflow = "hidden";
        Plot.container.appendChild(dot);
        dot = null;
      },
      //sin函数曲线,传入角度,比如90,180,360
      sin: function(angle){
        for(var i=0; i<angle; i++){
          Plot.drawDot(i,Math.sin(i/180*Math.PI)*100);
        }
      },
      //tan函数曲线
      tan: function(){
        for(var i=0; i<720; i++){
          if(Math.tan(i/180*Math.PI)*100>Plot.oy){
            continue;
          }
          Plot.drawDot( i, Math.tan(i/180*Math.PI)*50 );
        }
      },
      //cos函数曲线,传入角度,比如90,180,360
      cos: function(angle){
        for(var i=0; i<angle; i++){
          Plot.drawDot(i,Math.cos(i/180*Math.PI)*100);
        }
      },
      //画线从(x0,y0)到(x1,y1)
      line: function(x0,y0,x1,y1){
        //竖线
        if((x1-x0)==0){
          for( var i=((y1>y0)?y0:y1); i<((y1>y0)?y1:y0); i++ ){
            Plot.drawDot(x1, i);
          }
          return;
        }
        //横线
        if((y1-y0)==0){
          for( var i=((x1>x0)?x0:x1); i<((x1>x0)?x1:x0); i++ ){
            Plot.drawDot(i, y1);
          }
          return;
        }
        //斜线
        //k=斜率,直线方程为y=kx + b
        var k = (y1-y0)/(x1-x0);
        if(k<=1){
          for(var i=((x1>x0)?x0:x1); i<((x1>x0)?x1:x0); i++){
            Plot.drawDot(i, k*i+y1-k*x1 );
          }
        }
        else{
          for(var i=((y1>y0)?y0:y1); i<((y1>y0)?y1:y0); i++){
            Plot.drawDot((i-y1+k*x1)/k,i);
          }
        }
        return;
      },
      //画圆,radius是半径,(xi,yi)为圆心
      circle: function(radius,xi, yi){
        if((typeof xi)=='undefined'){
          xi = 0;
        }
        if((typeof yi)=='undefined'){
          yi = 0;
        }
        //i为角度,从0到360
        var i=0;
        while(i<360){
          var _x0 = Math.sin(i/180*Math.PI)*radius;
          var _y0 = Math.cos(i/180*Math.PI)*radius;
          var step = radius/100;
          //随着半径的增大,划出来的圆周断断续续,下面的做法
          //使画圆周的点数随着半径的增大而增大,使画出来的圆周更圆润.
          if(1/step>1){
            step = 1;
          }
          else if(1/step<0.2){
            step = 0.2;
          }
          else{
            step = 1/step;
          }
          Plot.drawDot(_x0+xi, _y0+yi);
          i = i+ step;
        }

      },
      //画多边形,传入一个点列
      polygon: function(dots){
        if(typeof dots=='undefined'){
          alert('you should specify some dots to draw!');
          return;
        }
        if(dots.constructor!=Array){
          alert('you should specify some dots to draw!');
          return;
        }
        for(var i=0; i<dots.length-1; i++){
          Plot.line(dots[i].x,dots[i].y, dots[i+1].x,dots[i+1].y);
          if(i==1&&dots.length==2){
            break;
          }
        }
        Plot.line(dots[0].x, dots[0].y,  dots[dots.length-1].x, dots[dots.length-1].y);
      }
    };


function createXHR()
{
    var xhr;
    try
    {
        xhr = new ActiveXObject("Msxml2.XMLHTTP");
    }
    catch (e)
    {
        try
        {
            xhr = new ActiveXObject("Microsoft.XMLHTTP");
        }
        catch(E)
        {
            xhr = false;
        }
    }

    if (!xhr && typeof XMLHttpRequest != 'undefined')
    {
        xhr = new XMLHttpRequest();
    }

    return xhr;
}

/*
 *异步访问提交处理
 */
function vector_load()
{


   //测试代码
     Plot.init('container',150,150, 'green','red',1);

    //Plot.setBrushWeight(3);

     //Plot.setBrushWeight(2);

     if(document.getElementById("paus").value=="暂停")
    {

    xhr = createXHR();

    if(xhr)
    {

        var get_str="cur_time=";
        get_str = get_str + new Date().getTime();
        //  get_str = get_str + Math.random();
        xhr.open("GET", "/test/cgi-bin/vector.cgi?" + get_str);
        xhr.send(null);

        xhr.onreadystatechange = callbackFunction;
    }
    else
    {
        alert("浏览器不支持,请更换浏览器!");
    }

    }
    else
    {
     document.getElementById("status").innerHTML="<span style='color:red;'>暂停中...</span>";
     //setTimeout("vector_load()",1000);
    }
}

 //异步回调函数处理

function callbackFunction()
{
    if (xhr.readyState == 4)
    {
        if (xhr.status == 200)
        {
            var returnValue = xhr.responseText;
            if(returnValue != null && returnValue.length > 0)
            {

                 var response = xhr.responseText.split("|");

                document.getElementById("vector1").value = response[0];
                document.getElementById("vector2").value = response[1];
                document.getElementById("vector3").value = response[2];
                document.getElementById("vector4").value = response[3];
                document.getElementById("vector5").value = response[4];


                     var vol_ax,vol_ay,vol_bx,vol_by,vol_cx,vol_cy;
                     var cur_ax,cur_ay,cur_bx,cur_by,cur_cx,cur_cy;

                    if(response[0]>=360)
                        {
                              vol_ax=100*Math.sin((response[0]-360)*pi/180);
                              vol_ay=100*Math.cos((response[0]-360)*pi/180);
                        }
                      else
                        {
                              vol_ax=100*Math.sin(Math.abs(response[0])*pi/180);
                              vol_ay=100*Math.cos(Math.abs(response[0])*pi/180);
                        }

                       if(response[1]>=360)
                        {
                              vol_bx=100*Math.sin((response[1]-360)*pi/180);
                              vol_by=100*Math.cos((response[1]-360)*pi/180);

                        }
                        else
                        {
                              vol_bx=100*Math.sin(response[1]*pi/180);
                              vol_by=100*Math.cos(response[1]*pi/180);

                        }

                      if(response[2]>=360)
                        {
                              vol_cx=100*Math.sin((response[2]-360)*pi/180);
                              vol_cy=100*Math.cos((response[2]-360)*pi/180);

                        }
                        else
                        {
                              vol_cx=100*Math.sin(response[2]*pi/180);
                              vol_cy=100*Math.cos(response[2]*pi/180);
                        }


                      if(response[3]>=360)
                        {
                              cur_bx=100*Math.sin((response[3]-360)*pi/180);
                              cur_by=100*Math.cos((response[3]-360)*pi/180);
                        }
                        else
                        {
                            cur_bx=Math.sin(response[3]/180*Math.PI)*100;
                            cur_by=Math.cos(response[3]/180*Math.PI)*100;
                        }
                      if(response[4]>=360)
                        {
                              cur_cx=100*Math.sin((response[4]-360)*pi/180);
                              cur_cy=100*Math.cos((response[4]-360)*pi/180);
                        }
                        else
                        {
                              cur_cx=Math.sin(response[4]/180*Math.PI)*100;
                              cur_cy=Math.cos(response[4]/180*Math.PI)*100;
                        }


                   Plot.container.innerHTML ="";
                  Plot.drawCoordinate();

                Plot.init('container', 150, 150, 'green','red',1);
                Plot.setBrushWeight(2);

                Plot.setBrushColor('blue');

                Plot.circle(100,0,0);


                //Plot.circle(100*Math.sqrt(2),0,0);

                Plot.setBrushColor('yellow');
                Plot.line(0,0,vol_ax,vol_ay);
                //     alert("7");


                Plot.setBrushColor('green');
                Plot.line(0,0,vol_bx,vol_by);

                         // alert("8");

                Plot.setBrushColor('red');
                Plot.line(0,0,vol_cx,vol_cy);


                Plot.setBrushColor('black');
                Plot.line(0,0,cur_bx,cur_by);

                         // alert("8");

                Plot.setBrushColor('white');
                Plot.line(0,0,cur_cx,cur_cy);

                 //alert("9");


           //  alert("333");

             //   document.getElementById("status").innerHTML="<span style='color:yellow;text-align:center;'>正常</span>";

                 setTimeout("vector_load()",1000);
                //  alert("10");

            }
            else
            {
             alert("访问数据为空!");
            }
        }
        else
        {
         alert("页面数据交互异常!");
        }
    }
}


 被折叠的 条评论
为什么被折叠?
被折叠的 条评论
为什么被折叠?
 到【灌水乐园】发言


