一、安装echarts
npm install echarts --save二、封装echarts组件
1、在src目录下新建components文件夹,里面新建echarts文件夹,在echarts文件夹新建index.vue,代码如下:
<template>
  <div
    ref="containerRef"
    :class="className"
    :style="{ height: height, width: width }"
    :option="option"
  ></div>
</template>

<script setup lang="ts">
import { ref, watch, onMounted, onUnmounted } from "vue";
import { ECharts, EChartsOption, init } from "echarts";
import { useClickAway } from "@vant/use";
import { useResize } from "@/hooks/useResize";
// 定义props
interface Props {
  className?: string;
  width?: string;
  height?: string;
  option: EChartsOption;
}
const props = withDefaults(defineProps<Props>(), {
  className: "chart",
  width: "100%",
  height: "100%",
  option: () => ({}),
});

const containerRef = ref<HTMLDivElement>();

let instance: ECharts | null = null;

// 引用vant组件api,解决echarts在移动端tooltip点击外面不消失问题
useClickAway(
  containerRef,
  () => {
    instance?.dispatchAction({ type: "hideTip" });
  },
  {
    eventName: "touchstart",
  }
);

// 路由切换,重置echarts尺寸
const resizeChart = () => {
  // 没有使用缓存的可以直接使用这个来自适应
  // instance.value?.dispose();
  // initChart();
  instance?.resize();
};

const initChart = (): void => {
  instance = init(containerRef.value as HTMLDivElement, void 0, {
    width: "auto",
    height: "auto",
  });
  instance?.setOption(props.option, true);
};
// 使用自定义hook,主要是全局使用了缓存组件,导致路由切换时,echars没办法自适应,hook见下面代码
useResize(resizeChart);

onMounted(() => {
  initChart();
});

onUnmounted(() => {
  if (instance) {
    instance?.dispose();
    instance = null;
  }
});

watch(
  () => props.option,
  () => {
    instance?.setOption(props.option, true);
  },
  {
    deep: true,
  }
);
// 导出echarts实例,为了方便后续在options中调用
defineExpose({
  getChart: () => instance,
});
</script>
<style lang="scss" scoped></style>
2、自定义hook,图表自适应屏幕
a. scr下新建hooks文件夹

b. useResize.ts 代码如下
import { onMounted, onBeforeUnmount, onActivated } from "vue";
import { debounce } from "lodash-es";

export function useResize(callback: () => void, timeout = 500) {
  const debounceResize = debounce(callback, timeout);
  onMounted(() => {
    window.addEventListener("resize", debounceResize);
  });

  onBeforeUnmount(() => {
    window.removeEventListener("resize", debounceResize);
  });
// 进入缓存组件是调用该方法,自适应尺寸
  onActivated(() => {
    callback();
  });
}
三、配置options
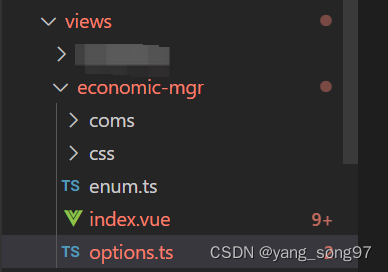
1、在views文件夹下新建options.ts

2、在options中导出配置项方法,方便在页面中调用
import { EChartsOption, graphic } from "echarts";
import { useI18n } from "vue-i18n";
// 自定义过滤器,方便后面对数据进行格式化处理
import { filtersNum } from "@/filters/index";
// 将公共样式提取出来,减少后续代码
const ScheduledColor = new graphic.LinearGradient(0, 0, 0, 1, [
  {
    offset: 0,
    color: "#A89E79",
  },
  {
    offset: 1,
    color: "#D3CEBB",
  },
]);

const ActivatedColor = new graphic.LinearGradient(0, 0, 0, 1, [
  { offset: 0, color: "#FFE600" },
  { offset: 1, color: "#FFF27D" },
]);

export function getChartOptionMap() {
// 项目做了国际化,不需要的可以不用管
  const { t, locale } = useI18n();
  return {
// 这里只是展示其中一个示例,有其他图表options可以在后面接着写
    getOrderPopupOptions: function (data: Array<any>, lenged?: string[]) {
      const option: EChartsOption = {
        dataset: [{ source: data }],

        xAxis: {
          type: "category",
          boundaryGap: false,
          axisTick: {
            interval: 0,
          },
          axisLine: {
            show: false, //隐藏x轴线
          },
          axisLabel: {
            interval: 0,
          },
          nameTextStyle: {
            lineHeight: 156,
          },
          minorTick: {
            length: 2,
          },
        },

        yAxis: {
          type: "value",
          min: "0", // 取数据在该轴上的最小值作为最小刻度
          // 动态获取最大值
          max: function () {
            const arr = [];
            data.forEach((item) => {
              arr.push(item.ord_cnt);
            });
            const maxNum = Math.max(...arr);
            return maxNum > 5 ? maxNum : 5;
          },

          position: "left",
          axisLine: {
            show: false,
          },
          splitLine: {
            show: false,
            lineStyle: {
              color: "rgba(0, 0, 0, 0.06)",
              width: 0.5,
            },
          },
          minInterval: 1,
        },

        grid: {
          left: 40,
          right: 20,
          top: 20,
          bottom: 20,
        },
        series: [
          {
            name: t("overview.orders"),
            type: "line",
            // smooth: true,
            symbol: "circle", //将小圆点改成实心 不写symbol默认空心
            symbolSize: 0, //小圆点的大小
            color: "#F3DE8A",
            lineStyle: {
              width: 1.5,
            },
            label: {
              show: true,
            },
            areaStyle: {
              color:ScheduledColor
            },
            encode: { x: "time_abbr", y: "ord_cnt" },
          },
        ],
      };
      return option;
    }
  };
}
四、在页面中使用
1、首先引入MyEcharts 组件
import MyEcharts from "@/components/MyEcharts/index.vue";2、在模板中使用
<MyEcharts :width="'100%'" :height="'240px'" :option="popupOptions" />3、引入options.ts,获取popupOptions
import { getChartOptionMap } from "./options";
const { getOrderPopupOptions } = getChartOptionMap();
// 这里选择用计算属性,不然会丢失响应
const popupOptions = computed(() => {
// 获取echarts图表所需要的data,根据自己项目要求获取即可,也可以在这里通过接口获取
  var carcode = popupIndex.value == "0" ? "ELETRE" : "EMIRA";
// 对数据进行了截取
  const data = orderCardChartData.value[carcode]?.slice(-7) ?? [];
// 调用getOrderPopupOptions方法,获取options配置并返回
  return getOrderPopupOptions(
// 项目要求,所以前端对时间做了格式化处理,根据自己项目要求来
    data.map((item: any) => ({ ...item, time_abbr: item.time_abbr?.slice(5) }))
  );
});


 380
380


 被折叠的 条评论
为什么被折叠?


