


项目的某个页面设计如下。主要难点
1.需要展示多个折线图或者横向堆叠柱状图,,图表切换。
2.需要导出图片或者图表,图表展示或者下载都需要自行加上合计。
一、安装echarts
可以自行搜索,暂不补充
二、折线图的一些操作注意点
1.一定要有id,我这边是传参过来的。另外高度也要写。
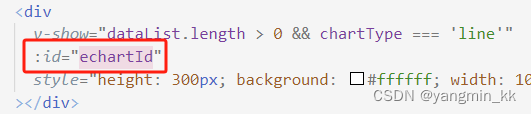
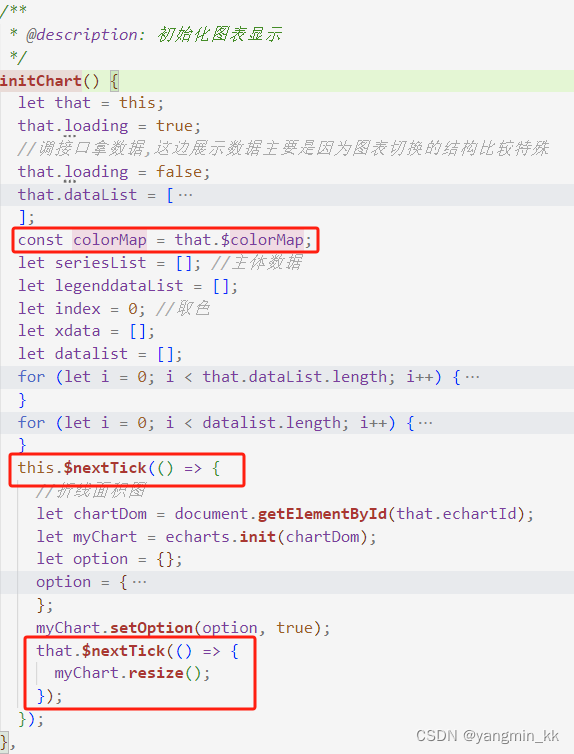
2. 初始化折线图的一些注意点
colorMap是我项目里面的全局变量,可以换成别的
两个 $nextTick() 一定不能少,加载完数据在画图
如果有 loading 的话需要在请求接口后就置为false,不要在画图表的时候去改为false,因为这时候父级还是没宽度,就会导致图表初始化按照默认的100px。
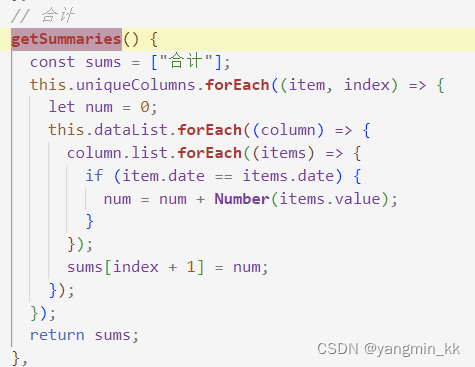
3.图表上的注意点
element里面的表格合计方法使用:summary-method="getSummaries"
图表使用一套数据时需要在computed里面计算出数据


3.折线图图表的下载

安装Export2Excel----可以参考以下链接,我直接安装没出现问题
前端使用Export2Excel将页面Table中的数据导出为Excel_实现table数据导出成表格-CSDN博客
下载图片其实echarts可以配置,但是我这边样式不一样最后还是用了自定义的下载图片
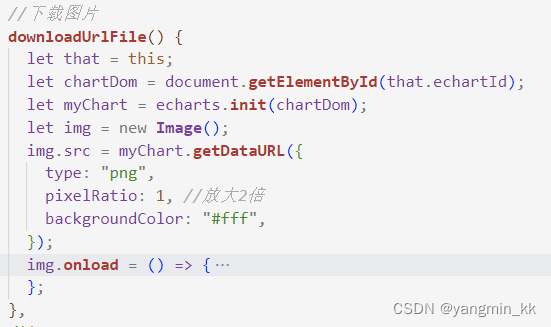
下载导出表格其实难点对我而言主要在于数据的组装和合计。另:使用合计需要给el-table高度。

三、折线图图表展示,图表切换,图表下载的整个代码
有少部分参数是传来的,也有部分样式是全局的,使用的时候可以自行调整
<template>
  <div class="useCount" id="useCount">
    <div class="useCount-top">
      <span class="downloadData-icon" @click="downloadData">
        <i class="el-icon-download" style="color: #6f7383"></i>
      </span>
      <div class="change-menu">
        <div
          class="left"
          @click="changeChartType('line')"
          :class="{ active: chartType === 'line' }"
        >
          <img
            v-if="chartType === 'line'"
            class="el-icon-s-operation icon_form"
            src="../../../../src/assets/icon-form/icon_mode_hover.svg"
          />
          <img
            v-if="chartType !== 'line'"
            class="el-icon-s-operation icon_form"
            src="../../../../src/assets/icon-form/icon_mode.svg"
          />
        </div>
        <div
          @click="changeChartType('list')"
          :class="{ active: chartType === 'list' }"
        >
          <img
            v-if="chartType === 'list'"
            class="icon_form"
            src="../../../../src/assets/icon-form/list_mode_hover.svg"
          />
          <img
            v-if="chartType !== 'list'"
            class="icon_form"
            src="../../../../src/assets/icon-form/list_mode.svg"
          />
        </div>
      </div>
    </div>
    <div
      v-show="loading"
      v-loading="loading"
      class="useCount-body echart-loading"
    ></div>
    <div class="useCount-body" v-show="!loading">
      <div class="nodata_style" v-show="!dataList || dataList.length == 0">
        <img src="../../../../src/assets/icon-form/nodata.svg" />
      </div>
      <div
        v-show="dataList.length > 0 && chartType === 'line'"
        :id="echartId"
        style="height: 300px; background: #ffffff; width: 100%; min-width: 100%"
      ></div>
      <div
        v-show="dataList.length > 0 && chartType === 'list'"
        style="height: 300px; overflow-y: auto"
      >
        <el-table
          height="300"
          show-summary
          :summary-method="getSummaries"
          :data="dataList"
        >
          <el-table-column
            prop="field"
            label="地点"
            fixed="left"
          ></el-table-column>
          <el-table-column
            v-for="col in uniqueColumns"
            :key="col.date"
            :prop="`list.${col.date}`"
            :label="col.date"
          >
            <template slot-scope="scope">
              {{ scope.row.list.find((item) => item.date == col.date).date }}
            </template>
          </el-table-column>
        </el-table>
      </div>
    </div>
  </div>
</template>
<script>
import echarts from "echarts";
export default {
  name: "",
  data() {
    return {
      chartType: "line",
      tableData: [
        {
          rowName: "row1",
          rowValues: [
            { value: "col1", data: "data1" },
            { value: "col2", data: "data2" },
          ],
        },
        {
          rowName: "row2",
          rowValues: [
            { value: "col1", data: "data3" },
            { value: "col2", data: "data4" },
          ],
        },
      ],
      dataList: [],
      loading: false,
    };
  },
  computed: {
    uniqueColumns() {
      const columns = new Set();
      this.dataList.forEach((row) => {
        row.list.forEach((item) => {
          columns.add(item.date);
        });
      });
      return Array.from(columns).map((date) => ({ date }));
    },
  },
  props: {
    echartName: "",
    echartId: "",
  },
  components: {},
  created() {},
  watch: {
  },
  mounted() {
    this.mountedFil();
  },
  methods: {
    // 初始化方法
    mountedFil() {
      this.initChart("line");
      this.getSummaries();
    },

    // 合计
    getSummaries() {
      const sums = ["合计"];
      this.uniqueColumns.forEach((item, index) => {
        let num = 0;
        this.dataList.forEach((column) => {
          column.list.forEach((items) => {
            if (item.date == items.date) {
              num = num + Number(items.value);
            }
          });
          sums[index + 1] = num;
        });
      });
      return sums;
    },
    /**
     * @description: 切换视图模式
     */
    changeChartType(val) {
      this.chartType = val;
      console.log(val);
      if (this.chartType === "line") {
        this.$nextTick(() => {
          if (document.getElementById(this.echartId)) {
            echarts.init(document.getElementById(this.echartId)).resize();
          }
        });
      }
    },
    /**
     * @description: 点击下载图表
     */
    downloadData() {
      let that = this;
      if (that.chartType === "line") {
        that.downloadUrlFile();
      }
      if (that.chartType === "list") {
        that.$message("数据导出中,请稍候...");
        let title =
          that.echartName +
          `表`
        let tHeader = [];
        let filterVal = [];
        require.ensure([], () => {
          const {
            export_json_to_excel,
          } = require("../../../vendor/Export2Excel");
          let col = ["地点"];
          let col2 = ["field"];
          let dataList = [];
          that.uniqueColumns.forEach((item, index) => {
            col.push(item.date);
            col2.push("field" + index);
          });
          that.dataList.forEach((column) => {
            let info = {};
            info["field"] = column.field;
            column.list.forEach((items) => {
              that.uniqueColumns.forEach((item, index) => {
                if (item.date == items.date) {
                  info["field" + index] = items.value;
                }
              });
            });
            dataList.push(info);
          });
          tHeader = col;
          filterVal = col2;
          if (dataList.length > 0) {
            let lastInfo = {};
            lastInfo.field = "合计";
            that.uniqueColumns.forEach((item, index) => {
              let num = 0;
              that.dataList.forEach((column) => {
                column.list.forEach((items) => {
                  if (item.date == items.date) {
                    num = num + Number(items.value);
                  }
                });
                lastInfo["field" + index] = num;
              });
            });
            dataList.push(lastInfo);
            const excelData = that.formatJson(filterVal, dataList);
            export_json_to_excel(tHeader, excelData, title);
          } else {
            that.$message({
              message: "没有数据可供导出",
              type: "warning",
            });
          }
        });
      }
    },
    formatJson(filterVal, jsonData) {
      return jsonData.map((v) =>
        filterVal.map((j) => {
          return v[j];
        })
      );
    },
    //下载图片
    downloadUrlFile() {
      let that = this;
      let chartDom = document.getElementById(that.echartId);
      let myChart = echarts.init(chartDom);
      let img = new Image();
      img.src = myChart.getDataURL({
        type: "png",
        pixelRatio: 1, //放大2倍
        backgroundColor: "#fff",
      });
      img.onload = () => {
        let reg = new RegExp("-", "g");
        let canvas = document.createElement("canvas");
        canvas.width = img.width;
        canvas.height = img.height;
        let ctx = canvas.getContext("2d");
        ctx.drawImage(img, 0, 0);
        let dataURL = canvas.toDataURL("image/png");
        let a = document.createElement("a");
        // 创建一个单击事件
        let event = new MouseEvent("click");
        // 将a的download属性设置为我们想要下载的图片名称,若name不存在则使用‘下载图片名称’作为默认名称
        a.download =
          that.echartName +".png";
        // 将生成的URL设置为a.href属性
        a.href = dataURL;
        // 触发a的单击事件
        a.dispatchEvent(event);
      };
    },
    /**
     * @description: 初始化图表显示
     */
    initChart() {
      let that = this;
      that.loading = true;
      //调接口拿数据,这边展示数据主要是因为图表切换的结构比较特殊
      that.loading = false;
      that.dataList = [
        {
          field: "广州",
          list: [
            {
              date: "2023-10",
              field: "2023-10",
              value: "11306",
            },
            {
              date: "2023-11",
              field: "2023-11",
              value: "333",
            },
            {
              date: "2023-12",
              field: "2023-12",
              value: "888",
            },
            ,
            {
              date: "2024-01",
              field: "2024-01",
              value: "666",
            },
          ],
        },
      ];
      const colorMap = that.$colorMap;
      let seriesList = []; //主体数据
      let legenddataList = [];
      let index = 0; //取色
      let xdata = [];
      let datalist = [];
      for (let i = 0; i < that.dataList.length; i++) {
        let obj = {};
        obj.name = that.dataList[i].field;
        obj.list = [];
        that.dataList[i].list.forEach((elements) => {
          obj.list.push(elements.value);
          if (i == 0) {
            xdata.push(elements.date);
          }
        });
        datalist.push(obj);
      }
      for (let i = 0; i < datalist.length; i++) {
        let color = colorMap[index];
        if (index >= colorMap.length - 1) {
          index = 0;
        } else {
          index++;
        }
        legenddataList.push(datalist[i].name);
        seriesList.push({
          name: datalist[i].name,
          label: {
            show: false,
            textStyle: {
              color: color,
            },
          },
          data: datalist[i].list,
          color: color, //改变折线点的颜色
          lineStyle: {
            color: color, //改变折线颜色
            width: 0.5,
          },
          type: "line",
          smooth: false,
          showSymbol: true,
          areaStyle: {
            color: {
              type: "linear",
              x: 0,
              y: 0,
              x2: 0,
              y2: 1,
              colorStops: [
                {
                  offset: 0,
                  color: color, // 0% 处的颜色
                },
                {
                  offset: 1,
                  color: "#ffffff", // 100% 处的颜色
                },
              ],
              global: false, // 缺省为 false
            },
          },
        });
      }
      this.$nextTick(() => {
        //折线面积图
        let chartDom = document.getElementById(that.echartId);
        let myChart = echarts.init(chartDom);
        let option = {};
        option = {
          legend: {
            type: "scroll",
            data: legenddataList, //图例数据
            textStyle: {
              // fontWeight: 'lighter',
              // color: '#ffffff', // 图例文字颜色
            },
            icon: "rect", // 图例icon为方块
            //   orient: 'vartical',
            top: "7%", //距头部多远
            // right: "0",
            left: "100",
            itemWidth: 10,
            itemHeight: 10,
            itemGap: 16,
            padding: [0, 0, 50, 0],
          },
          tooltip: {
            trigger: "axis",
            // confine: true, //限制tootip在容器内,解决浮窗被截断问题
            axisPointer: {
              // 坐标轴指示器,坐标轴触发有效
              type: "line", // 默认为直线,可选为:'line' | 'shadow'
            },
            formatter: function (params) {
              let astr = "";
              params.forEach((ele) => {
                const data = ele.data;
                // 不为0的展示
                if (ele.seriesName && data) {
                  astr += `
                    <div style="display: block;height:20px;width: 100px;float:left;">
                      <i style="width: 10px;height: 10px;display: inline-block;background: ${ele.color};border-radius: 10px;"></i>
                      <span>${ele.seriesName}: ${data}</span>
                    </div>
                 `;
                }
              });
              const b = '<div style="min-width:50px">' + astr + "<div>";
              return b;
            },
            position: function (point, params, dom, rect, size) {
              return [point[1], 0];
            },
            valueFormatter: function (value) {
              return value;
            },
          },
          grid: {
            //图表的整体位置
            show: false,
            right: "30",
            bottom: "40",
            left: "50",
            top: "50",
          },
          xAxis: {
            type: "category",
            axisLine: {
              show: true,
              lineStyle: {
                color: "#cccccc70",
              },
            },
            interval: 0, //使x轴文字显示全
            axisLabel: {
              //x轴文字的配置
              show: true,
              textStyle: {
                color: "#aaa",
                fontSize: 10,
              },
              rotate: -30,
            },
            //   boundaryGap: false,
            show: true,
            axisTick: {
              //x轴刻度线
              show: false,
            },
            data: xdata,
          },
          yAxis: {
            name: "次数",
            nameTextStyle: {
              color: "#333",
              nameLocation: "start",
              padding: [0, 0, 0, -40],
            },
            type: "value",
            axisLine: {
              show: false,
              lineStyle: {
                color: "#aaaaaa",
              },
            },
            axisLabel: {
              //x轴文字的配置
              show: true,
              textStyle: {
                //   color: '#ffffff',
              },
            },
            splitLine: {
              show: true,
              lineStyle: {
                color: "#cccccc70",
              },
            }, //背景网格线
          },
          series: seriesList,
        };
        myChart.setOption(option, true);
        that.$nextTick(() => {
          myChart.resize();
        });
      });
    },
  },
};
</script>
  <style lang='scss' scoped>
.useCount {
  position: relative;
}
.useCount-top {
  height: 30px;
  line-height: 30px;
  margin-bottom: 14px;
  display: flex;
}
.change-menu {
  position: absolute;
  top: 0px !important;
  right: 8px;
  display: flex;
  border: 1px solid #dddddd;
  border-radius: 20px;
  z-index: 100;
  overflow: hidden;
  div {
    padding: 2px 8px;
    cursor: pointer;
    &.active {
      color: #17908e;
    }
  }
  div:hover {
    background: #dddddd;
    color: #17908e;
  }
  .left {
    border-right: 1px solid #dddddd;
  }
}
.downloadData-icon {
  position: absolute;
  right: 100px;
  top: -2px;
  font-size: 20px;
  cursor: pointer;
}
.useCount-top-text {
  display: inline-block;
  color: #333333;
  border-left: 2px solid #17908e;
  padding-left: 5px;
  font-size: 16px;
}
.icon_form {
  padding: 2px;
  display: flex;
  align-items: center;
  text-align: center;
  vertical-align: middle;
}
</style>
  <style lang='scss'>
</style>
四、堆叠柱状图的图表展示,图表切换,图表下载的整个代码
堆叠图主要是数据较多,比折线图多了一个展示作用的更多,收起。
数据结构是跟折线图差不多的。注意点也参考折线图
<template>
<div class="useCount-rank">
<div class="useCount-rank-top">
<span class="downloadData-icon" @click="downloadData">
<i class="el-icon-download" style="color: #6f7383"></i>
</span>
<div class="change-menu">
<div
class="left"
@click="changeChartType('bar')"
:class="{ active: chartType === 'bar' }"
>
<img
v-show="chartType === 'bar'"
class="el-icon-s-operation icon_form"
src="../../../../src/assets/icon-form/icon_mode_hover.svg"
/>
<img
v-show="chartType !== 'bar'"
class="el-icon-s-operation icon_form"
src="../../../../src/assets/icon-form/icon_mode.svg"
/>
</div>
<div
@click="changeChartType('list')"
:class="{ active: chartType === 'list' }"
>
<img
v-show="chartType === 'list'"
class="icon_form"
src="../../../../src/assets/icon-form/list_mode_hover.svg"
/>
<img
v-show="chartType !== 'list'"
class="icon_form"
src="../../../../src/assets/icon-form/list_mode.svg"
/>
</div>
</div>
</div>
<div
v-show="loading"
v-loading="loading"
class="useCount-rank-body echart-loading"
></div>
<div class="useCount-rank-body" v-show="!loading">
<div class="nodata_style" v-show="!dataList || dataList.length == 0">
<img src="../../../../src/assets/icon-form/nodata.svg" />
</div>
<div v-show="dataList.length > 0 && chartType === 'bar'">
<div
v-show="dataList.length > 0"
class="horizontalLine"
:style="{ height: showAll ? dataList.length * 54 + 'px' : '300px' }"
>
<div
style="min-height: 300px"
:id="echartId"
:style="{ width: '100%', height: dataList.length * 54 + 'px' }"
/>
</div>
<p
style="text-align: center; cursor: pointer"
class="more-btn"
@click="handleClickMore"
>
<span>{{ showAll ? "收起" : "更多" }}</span>
<i v-if="!showAll" class="el-icon-caret-bottom" />
<i v-else class="el-icon-caret-top" />
</p>
</div>
<div
v-show="dataList.length > 0 && chartType === 'list'"
style="height: 300px; overflow-y: auto"
>
<el-table
height="300"
show-summary
:summary-method="getSummaries"
:data="dataList"
>
<el-table-column
prop="field"
label="功能"
fixed="left"
></el-table-column>
<el-table-column
v-for="col in uniqueColumns"
:key="col.field"
:prop="`list.${col.field}`"
:label="col.field"
>
<template slot-scope="scope">
{{ scope.row.list.find((item) => item.field == col.field).value }}
</template>
</el-table-column>
</el-table>
</div>
</div>
</div>
</template>
<script>
import echarts from "echarts";
export default {
name: "",
data() {
return {
showAll: false,
showAll2: false,
chartType: "bar",
dataList: [],
loading: false,
};
},
computed: {
uniqueColumns() {
const columns = new Set();
this.dataList.forEach((row) => {
row.list.forEach((item) => {
columns.add(item.field);
});
});
return Array.from(columns).map((field) => ({ field }));
},
},
props: {
echartId: "",
},
components: {},
created() {},
watch: {},
mounted() {
this.mountedFil();
},
methods: {
// 初始化方法
mountedFil() {
this.initChart();
this.getSummaries();
},
handleClickMore() {
this.showAll = !this.showAll;
},
// 合计
getSummaries() {
const sums = ["合计"];
this.uniqueColumns.forEach((item, index) => {
let num = 0;
this.dataList.forEach((column) => {
column.list.forEach((items) => {
if (item.field == items.field) {
num = num + Number(items.value);
}
});
sums[index + 1] = num;
});
});
return sums;
},
/**
* @description: 切换视图模式
*/
changeChartType(val) {
this.chartType = val;
if (this.chartType === "bar") {
this.showAll = false;
this.$nextTick(() => {
if (document.getElementById(this.echartId)) {
echarts.init(document.getElementById(this.echartId)).resize();
}
});
} else {
this.showAll2 = false;
}
},
/**
* @description: 点击下载图表
*/
downloadData() {
let that = this;
if (that.chartType === "bar") {
that.downloadUrlFile();
}
if (that.chartType === "list") {
that.$message("数据导出中,请稍候...");
let title = that.echartName + `表`;
let tHeader = [];
let filterVal = [];
require.ensure([], () => {
const {
export_json_to_excel,
} = require("../../../vendor/Export2Excel");
let col = ["地点"];
let col2 = ["field"];
let dataList = [];
that.uniqueColumns.forEach((item, index) => {
col.push(item.field);
col2.push("field" + index);
});
that.dataList.forEach((column) => {
let info = {};
info["field"] = column.field;
column.list.forEach((items) => {
that.uniqueColumns.forEach((item, index) => {
if (item.field == items.field) {
info["field" + index] = items.value;
}
});
});
dataList.push(info);
});
tHeader = col;
filterVal = col2;
if (dataList.length > 0) {
let lastInfo = {};
lastInfo.field = "合计";
that.uniqueColumns.forEach((item, index) => {
let num = 0;
that.dataList.forEach((column) => {
column.list.forEach((items) => {
if (item.field == items.field) {
num = num + Number(items.value);
}
});
lastInfo["field" + index] = num;
});
});
dataList.push(lastInfo);
const excelData = that.formatJson(filterVal, dataList);
export_json_to_excel(tHeader, excelData, title);
} else {
that.$message({
message: "没有数据可供导出",
type: "warning",
});
}
});
}
},
formatJson(filterVal, jsonData) {
return jsonData.map((v) =>
filterVal.map((j) => {
return v[j];
})
);
},
//下载图片
downloadUrlFile() {
let that = this;
let chartDom = document.getElementById(that.echartId);
let myChart = echarts.init(chartDom);
let img = new Image();
img.src = myChart.getDataURL({
type: "png",
pixelRatio: 1, //放大2倍
backgroundColor: "#fff",
});
img.onload = () => {
let reg = new RegExp("-", "g");
let canvas = document.createElement("canvas");
canvas.width = img.width;
canvas.height = img.height;
let ctx = canvas.getContext("2d");
ctx.drawImage(img, 0, 0);
let dataURL = canvas.toDataURL("image/png");
let a = document.createElement("a");
// 创建一个单击事件
let event = new MouseEvent("click");
// 将a的download属性设置为我们想要下载的图片名称,若name不存在则使用‘下载图片名称’作为默认名称
a.download = that.echartName + ".png";
// 将生成的URL设置为a.href属性
a.href = dataURL;
// 触发a的单击事件
a.dispatchEvent(event);
};
},
/**
* @description: 初始化图表显示
*/
initChart() {
let that = this;
that.loading = true;
//调接口拿数据,这边展示数据主要是因为图表切换的结构比较特殊
that.loading = false;
that.dataList = [
{
field: "广州",
value: "9682",
list: [
{ field: "A", value: "1162" },
{ field: "B", value: "231" },
{ field: "C", value: "7048" },
{ field: "D", value: "1241" },
],
},
{
field: "四川",
value: "3349",
list: [
{ field: "A", value: "0" },
{ field: "B", value: "174" },
{ field: "C", value: "3175" },
{ field: "D", value: "0" },
],
},
];
let judgesChartList = [];
let judgesChartMap = [];
let judgesChartMapTip = [];
that.dataList.forEach((element) => {
judgesChartMap.push(element.field);
judgesChartList.push(element.value);
if (element.list) {
//取出描述
let text = "";
let list = [];
for (let i = 0; i < element.list.length; i++) {
const elements = element.list[i];
if (elements.value > 0) {
list.push(elements);
}
}
for (let j = 0; j < list.length; j++) {
const element_base = list[j];
text += `${element_base.field}${element_base.value}${
j < list.length - 1 ? "," : ""
}`;
}
judgesChartMapTip.push(text);
}
});
that.$nextTick(() => {
let chartDom = document.getElementById(that.echartId);
if (chartDom) {
let myChart = echarts.init(chartDom);
//处理图例和需要的数据
let legendList = [];
let seriesList = []; //数据轴列表
let allData = [];
let list = that.dataList[0].list; //取出第一个人的数据作为图例
for (let i = 0; i < list.length; i++) {
legendList.push(list[i].field);
allData.push([]);
}
that.dataList.forEach((element) => {
for (let j = 0; j < element.list.length; j++) {
allData[j].push(element.list[j].value);
}
});
for (let i = 0; i < legendList.length; i++) {
seriesList.push(
// 亮色条 百分比
{
name: legendList[i],
stack: true,
show: true,
type: "bar",
barGap: "-100%",
barWidth: "8px",
showBackground: true, //柱状背景
backgroundStyle: {
//背景颜色,加透明度
color: "#ffffff",
},
z: 2,
itemStyle: {
normal: {
// barBorderRadius: 4,
color: that.$colorMap[i * 3],
},
},
label: {
normal: {
show: false,
textStyle: {
color: "#4a4a4a",
fontSize: 12,
},
position: "right",
formatter: (data) => {
return data.data;
},
},
},
data: allData[i],
}
);
}
seriesList.push({
show: true,
type: "bar",
xAxisIndex: 1, // 代表使用第二个X轴刻度
barGap: "-100%",
barWidth: 20,
itemStyle: {
normal: {
barBorderRadius: 200,
color: "transparent",
},
},
label: {
normal: {
show: true,
position: [0, "-20"],
textStyle: {
fontSize: 12,
color: "#4a4a4a",
},
formatter: (data) => {
return (
judgesChartMap[data.dataIndex] +
` (${judgesChartMapTip[data.dataIndex]}) `
);
},
},
},
data: judgesChartList,
});
seriesList.push({
show: true,
type: "bar",
xAxisIndex: 1, // 代表使用第二个X轴刻度
barGap: "-120%",
barWidth: 20,
itemStyle: {
normal: {
barBorderRadius: 200,
color: "transparent",
},
},
label: {
normal: {
show: true,
position: "right",
textStyle: {
fontSize: 12,
color: "#4a4a4a",
},
formatter: (data) => {
return `${judgesChartList[data.dataIndex]}`;
},
},
},
data: judgesChartList,
});
let option = {
legend: {
type: "scroll",
data: legendList, //图例数据
textStyle: {},
icon: "rect", // 图例icon为方块
// orient: 'vartical',
top: "0", //距头部多远
right: "0",
bottom: "100",
itemWidth: 12.5,
itemHeight: 12.5,
itemGap: 16,
padding: [0, 0, 50, 0],
},
grid: {
left: "30",
right: "15%",
bottom: "5%",
top: "30",
},
xAxis: [
{
show: false,
},
{
show: false,
},
],
yAxis: {
data: judgesChartMap,
type: "category",
inverse: true,
show: false,
},
series: seriesList,
};
myChart.setOption(option, true);
that.$nextTick(() => {
myChart.resize();
});
}
});
},
},
};
</script>
<style lang='scss' scoped>
.useCount-rank {
position: relative;
}
.useCount-rank-top {
height: 30px;
line-height: 30px;
margin-bottom: 14px;
display: flex;
}
.change-menu {
position: absolute;
top: 0px !important;
right: 8px;
display: flex;
border: 1px solid #dddddd;
border-radius: 20px;
z-index: 100;
overflow: hidden;
div {
padding: 2px 8px;
cursor: pointer;
&.active {
color: #17908e;
}
}
div:hover {
background: #dddddd;
color: #17908e;
}
.left {
border-right: 1px solid #dddddd;
}
}
.downloadData-icon {
position: absolute;
right: 100px;
top: -2px;
font-size: 20px;
cursor: pointer;
}
.useCount-rank-top-text {
display: inline-block;
color: #333333;
border-left: 2px solid #17908e;
padding-left: 5px;
font-size: 16px;
}
.horizontalLine-body {
position: relative;
}
.horizontalLine {
overflow: hidden;
transition: all 0.3s ease-in-out;
min-height: 270px;
}
.icon_form {
padding: 2px;
display: flex;
align-items: center;
text-align: center;
vertical-align: middle;
}
.useCount-switch {
font-size: 14px;
background-color: #f7f9f9;
margin-left: 14px;
min-width: 140px;
display: flex;
text-align: center;
border-radius: 5px;
height: 35px;
line-height: 35px;
cursor: pointer;
}
.useCount-switch-normal {
align-items: center;
height: 30px;
background-color: #f7f9f9;
border-radius: 5px;
min-width: 65px;
color: #999999;
}
.useCount-switch-select {
align-items: center;
height: 30px;
background-color: #ffffff;
min-width: 65px;
color: #333333;
}
</style>
<style lang='scss'>
</style>


 8701
8701


 被折叠的 条评论
为什么被折叠?
被折叠的 条评论
为什么被折叠?
 到【灌水乐园】发言


