


Electron + Vue + Vscode构建跨平台应用(一)知识点补充
Electron + Vue + Vscode构建跨平台应用(二)Electron + Vue环境搭建
Electron + Vue + Vscode构建跨平台应用(三)利用webpack搭建vue项目
Electron + Vue + Vscode构建跨平台应用(四)利用Electron-Vue构建Vue应用详解
Electron + Vue + Vscode构建跨平台应用(五)Electron-Vue项目源码分析
Electron + Vue跨平台应用(六)效果还不错的登录页面
Electron + Vue跨平台应用(七)基础技法(一)
Electron + Vue跨平台应用(八)基础技法(二)
Electron + Vue跨平台应用(八)基础技法(三)
Electron + Vue跨平台应用(九)基础技法(四)
Electron + Vue跨平台应用(十)可视化(一)
- 在main.js文件中全局引入
import echarts from 'echarts'
Vue.prototype.$echarts = echarts
- 在vue页面中引入div,并完成Echarts的初始化
<div id="myChart" :style="{width: '600px', height: '400px'}"></div>
    initEcharts () {
      this.echart = this.$echarts.init(document.getElementById('myChart'))
    },
- 最后一步就是填充Echarts数据,完整代码如下
<template>
  <div class="main">
    <div id="myChart" :style="{width: '600px', height: '400px'}"></div>
  </div>
</template>

<script>
export default {
  name: 'EchartsActivity',
  data () {
    return {
      echart: null,
      option: {},
      graphData: [{
        name: '节点1',
        id: 1
      }, {
        name: '节点2',
        id: 2
      }, {
        name: '节点3',
        id: 3
      }, {
        name: '节点4',
        id: 4
      }, {
        name: '节点5',
        id: 5
      }, {
        name: '节点6',
        id: 6
      }],
      graphLinks: [{
        source: '1',
        target: '2'
      }, {
        source: '2',
        target: '3'
      }, {
        source: '2',
        target: '4'
      }, {
        source: '3',
        target: '5'
      }, {
        source: '4',
        target: '6'
      }]
    }
  },
  mounted () {
    this.initEcharts()
    this.setOption()
    this.reFreshEcharts()
  },
  methods: {
    initEcharts () {
      this.echart = this.$echarts.init(document.getElementById('myChart'))
    },
    setOption () {
      let graphOption = {
        title: {
          text: '关系图示例'
        },
        tooltip: {},
        series: [
          {
            type: 'graph',
            layout: 'force',
            data: this.graphData,
            links: this.graphLinks,
            force: {
              repulsion: 500
            },
            lineStyle: {
              opacity: 0.9,
              width: 2,
              curveness: 0
            }
          }
        ]
      }
      this.option = graphOption
    },
    reFreshEcharts () {
      this.$nextTick(() => {
        this.echart.setOption(this.option)
      })
    }
  }
}
</script>

<!-- Add "scoped" attribute to limit CSS to this component only -->
<style scoped>
</style>
显示效果如下
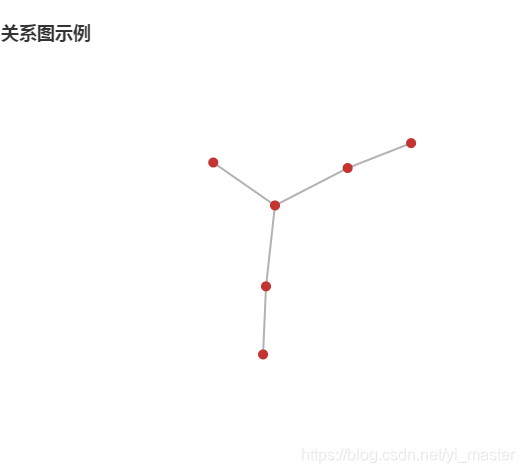
那没有固定坐标的关系图的节点位置是如何确定的? 其实他是根据力导图算法动态分布的。
那如果我们需要 固定某些节点要如何处理尼?
通过查看Echarts配置项可知,关系图的data数据有如下部分属性
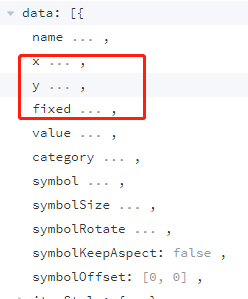
所以我们只要通过设置data的数据fixed属性为true,并且设置对应x和y的坐标即可固定节点位置,完整代码如下
<template>
  <div class="main">
    <div id="myChart" :style="{width: '600px', height: '400px'}"></div>
    <button>关系图</button>
    <button>仪表盘</button>
  </div>
</template>

<script>
export default {
  name: 'EchartsActivity',
  data () {
    return {
      echart: null,
      option: {},
      graphData: [{
        name: '节点1',
        id: 1,
        fixed: true,
        x: 100,
        y: 50
      }, {
        name: '节点2',
        id: 2,
        fixed: true,
        x: 180,
        y: 50
      }, {
        name: '节点3',
        id: 3
      }],
      graphLinks: [{
        source: '1',
        target: '2'
      }, {
        source: '2',
        target: '3'
      }]
    }
  },
  mounted () {
    this.initEcharts()
    this.setOption()
    this.reFreshEcharts()
  },
  methods: {
    initEcharts () {
      this.echart = this.$echarts.init(document.getElementById('myChart'))
    },
    setOption () {
      let graphOption = {
        title: {
          text: '关系图示例'
        },
        tooltip: {},
        series: [
          {
            type: 'graph',
            layout: 'force',
            data: this.graphData,
            links: this.graphLinks,
            force: {
              repulsion: 500
            },
            lineStyle: {
              opacity: 0.9,
              width: 2,
              curveness: 0
            }
          }
        ]
      }
      this.option = graphOption
    },
    reFreshEcharts () {
      this.$nextTick(() => {
        this.echart.setOption(this.option)
      })
    }
  }
}
</script>

<!-- Add "scoped" attribute to limit CSS to this component only -->
<style scoped>
</style>
显示效果如下:
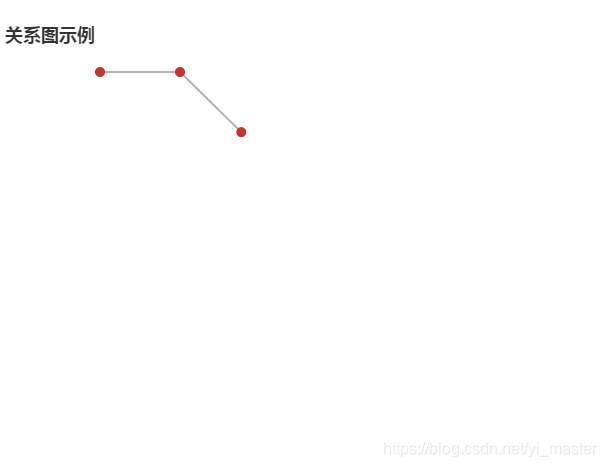
通过上面你的属性设置就完成了关系图固定节点的功能,同时我们也可以知道关系图中坐标系的(0,0)点屏幕左上角
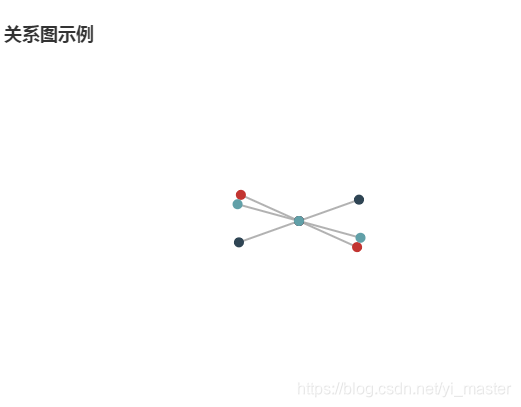
当关系图中的力导图如果节点过多,在绘制的时候性能比较慢,那我们要如何加快这种渲染速度?
通过上面的代码我们发现,series对象里面的data是组成关系图的重要数据,而series是一个数组对象,所以为了优化过多节点的渲染速度,我们可以为series就像分片数据一样设置多个数据,完整代码如下
<template>
  <div class="main">
    <div id="myChart" :style="{width: '600px', height: '400px'}"></div>
    <button>关系图</button>
    <button>仪表盘</button>
  </div>
</template>

<script>
export default {
  name: 'EchartsActivity',
  data () {
    return {
      echart: null,
      option: {},
      graphData: [{
        name: '节点1',
        id: 1
      }, {
        name: '节点2',
        id: 2
      }, {
        name: '节点3',
        id: 3
      }],
      graphLinks: [{
        source: '1',
        target: '2'
      }, {
        source: '2',
        target: '3'
      }]
    }
  },
  mounted () {
    this.initEcharts()
    this.setOption()
    this.reFreshEcharts()
  },
  methods: {
    initEcharts () {
      this.echart = this.$echarts.init(document.getElementById('myChart'))
    },
    setOption () {
      let graphOption = {
        title: {
          text: '关系图示例'
        },
        tooltip: {},
        series: [
          {
            type: 'graph',
            layout: 'force',
            data: this.graphData,
            links: this.graphLinks,
            force: {
              repulsion: 500
            },
            lineStyle: {
              opacity: 0.9,
              width: 2,
              curveness: 0
            }
          }, {
            type: 'graph',
            layout: 'force',
            data: this.graphData,
            links: this.graphLinks,
            force: {
              repulsion: 500
            },
            lineStyle: {
              opacity: 0.9,
              width: 2,
              curveness: 0
            }
          }
        ]
      }
      this.option = graphOption
    },
    reFreshEcharts () {
      this.$nextTick(() => {
        this.echart.setOption(this.option)
      })
    }
  }
}
</script>

<!-- Add "scoped" attribute to limit CSS to this component only -->
<style scoped>
</style>
显示效果如下
补充说明一个在使用关系图常见的异常
Cannot set property 'dataIndex' of undefined
出现这个异常的原因是在你的关系图中出现了重复数据,一般是指id重复


 3520
3520


 被折叠的 条评论
为什么被折叠?
被折叠的 条评论
为什么被折叠?
 到【灌水乐园】发言


