


随机森林模型的训练以及特征重要性
import xlrd
import csv
import numpy as np
import pandas as pd
import matplotlib.pyplot as plt
from scipy.interpolate import spline
#设置路径
path='/Users/kqq/Documents/postgraduate/烟叶原始光谱2017.4.7数字产地.csv'
#读取文件
df = pd.read_csv(path, header = 0)
#df.info()
#训练随机森林模型
from sklearn.cross_validation import train_test_split
from sklearn.ensemble import RandomForestClassifier
x, y = df.iloc[:, 1:].values, df.iloc[:, 0].values
x_train, x_test, y_train, y_test = train_test_split(x, y, test_size = 0.3, random_state = 0)
feat_labels = df.columns[1:]
forest = RandomForestClassifier(n_estimators=10000, random_state=0, n_jobs=-1)
forest.fit(x_train, y_train)
#打印特征重要性评分
importances = forest.feature_importances_
#indices = np.argsort(importances)[::-1]
imp=[]
for f in range(x_train.shape[1]):
print(f + 1, feat_labels[f], importances[f])
#将打印的重要性评分copy到featureScore.xlsx中;plot特征重要性
#设置路径
path='/Users/kqq/Documents/postgraduate/实验分析图/featureScore.xlsx'
#打开文件
myBook=xlrd.open_workbook(path)
#查询工作表
sheet_1_by_index=myBook.sheet_by_index(0)
data=[]
for i in range(0,sheet_1_by_index.nrows):
data.append(sheet_1_by_index.row_values(i))
data=np.array(data)
X=data[:1,].ravel()
y=data[1:,]
plt.figure(1,figsize=(8, 4))
i=0
print(len(y))
while i<len(y):
#power_smooth = spline(X,y[i],xnew)
#plt.grid(True)
plt.legend(loc='best')
plt.plot(X,y[i],linewidth=1)
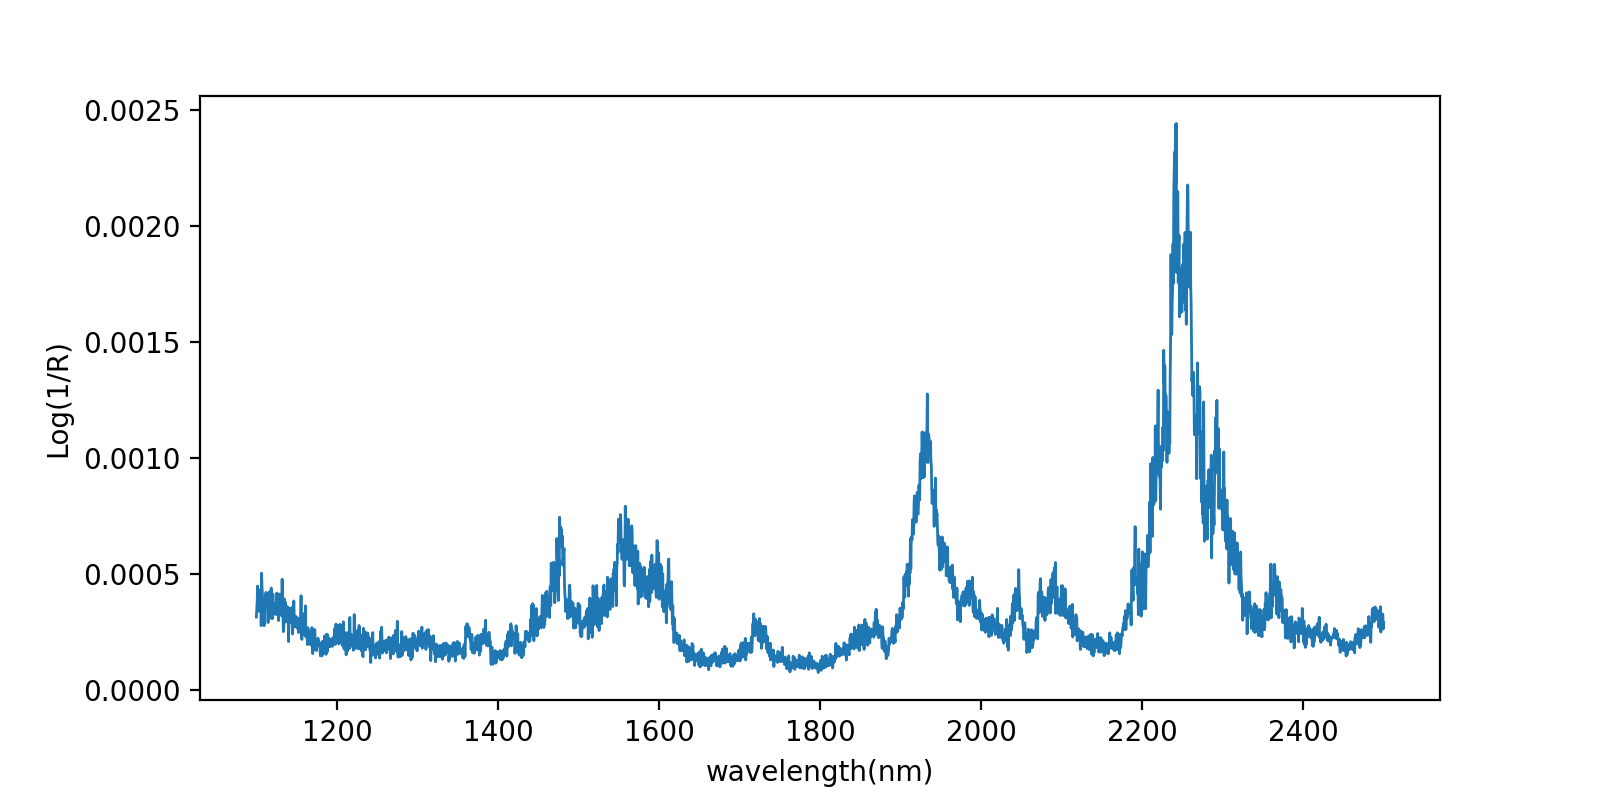
plt.ylabel('Log(1/R)')
plt.xlabel('wavelength(nm)')
i=i+1
plt.legend(loc='best')
plt.savefig('/Users/kqq/Documents/postgraduate/实验图/featureScore', dpi=200)
plt.show()特征重要性的展示:
原始数据:点击打开链接 密码:71nu
特征重要性:点击打开链接 密码:53jl


 1万+
1万+


 被折叠的 条评论
为什么被折叠?
被折叠的 条评论
为什么被折叠?
 到【灌水乐园】发言


