


关于Android恶意软件的分类模型研究
数据集地址:https://www.unb.ca/cic/datasets/maldroid-2020.html
数据集文件:feature_vectors_syscallsbinders_frequency_5_Cat.csv
一、问题分析
1、按照问题一的要求,我们将数据集按照test_size=0.2的比例划分为训练集和测试集,并采用多种模型进行求解。具体选用的模型包括逻辑回归、随机森林、支持向量机、梯度提升以及K近邻,以这些模型对数据集进行分析和处理。
2、针对问题二的需求,我们同样采用多种模型对数据集进行求解,并生成相应的混淆矩阵。通过对准确率、宏召回率(macro_R)、微召回率(micro_R)、宏精确率(macro_P)、微精确率(micro_P)、宏F1分数(macro-F1)以及微F1分数(micro-F1)这七个指标的分析,我们可以评估模型的好坏,并绘制出相应的混淆矩阵。
3、根据问题三的要求,在模型训练与评估之后,我们需要处理数据不平衡的问题。为了解决样本不平衡的情况,我们将类别1的样本数量扩充至1500个,采用的方法是SMOTE(Synthetic Minority Over-sampling Technique)。
4、对于问题四,我们将使用PCA(Principal Component Analysis)进行主成分分析,以此来实现数据的降维处理。
二、问题求解
首先使用 pandas 的 read_csv 方法加载的数据集。然后从数据集中分离出特征 X和标签 y。按照题目所给出的要求,使用 train_test_split 方法将数据集分割为训练集和测试集,测试集占总数据的20%,且将随机种子设为42以保证结果的可重复性。如果测试集中所有样本都属于同一类,则打印警告信息,因为这会影响分类指标的意义。使用 StandardScaler 对特征进行标准化处理,以确保每个特征对模型的贡献是均等的。然后开始初始化模型,创建一个包含多个分类模型的字典,这里包括逻辑回归(Logistic Regression)、随机森林(Random Forest)、支持向量机(SVM)、K近邻(KNN)、梯度提升决策树(Gradient Boosting)。接着训练模型并存储结果,遍历模型字典,对每个模型进行训练,并使用测试集进行预测。存储每个模型的准确率、分类报告和混淆矩阵。然后提取并打印评价指标,从结果中提取准确率、召回率、精确率和F1分数(宏平均和加权平均),并格式化打印。最后绘制混淆矩阵:这里定义一个函数 plot_confusion_matrix 用于绘制混淆矩阵。遍历结果字典,为每个模型绘制混淆矩阵。
三、结果展示
对于问题一和问题二
通过以上5种模型对该数据集求解,可得到相应的准确率、宏召回率、微召回率、宏精确率、微精确率、宏F1分数、微F1分数,并做出表格如下:
表1:多种模型各指标表
| 模型 | Acc | micro_p | macro_p | micro_r | macro_r | micro_f1 | macro_f1 |
| 逻辑回归 | 0.8547 | 0.8556 | 0.8466 | 0.8556 | 0.8246 | 0.8556 | 0.8340 |
| 随机森林 | 0.9448 | 0.9444 | 0.9339 | 0.9444 | 0.9356 | 0.9444 | 0.9341 |
| SVM | 0.7892 | 0.8672 | 0.8560 | 0.8672 | 0.8387 | 0.8672 | 0.8458 |
| 梯度提升 | 0.9263 | 0.9342 | 0.9201 | 0.9342 | 0.9133 | 0.9342 | 0.8421 |
| KNN | 0.8698 | 0.8698 | 0.8504 | 0.8698 | 0.8370 | 0.8698 | 0.8400 |
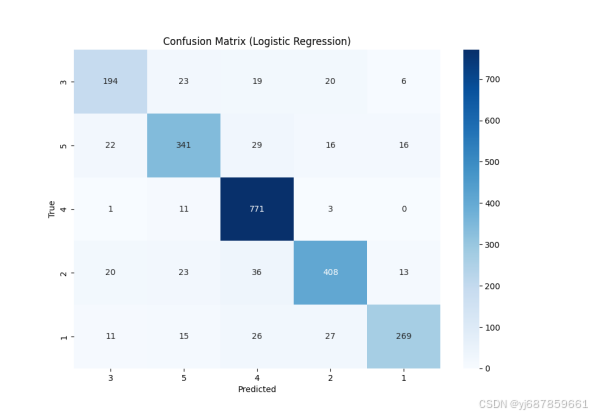
图1:逻辑回归混淆矩阵
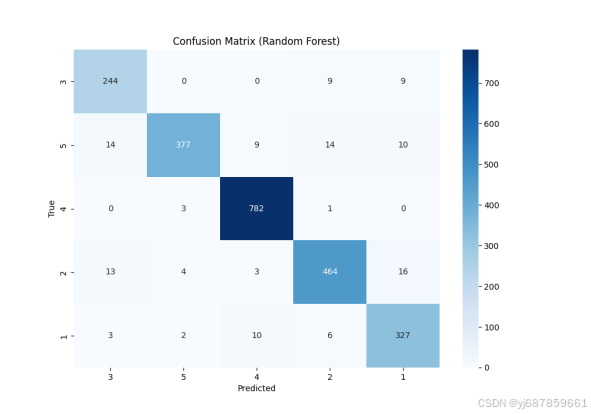
图2:随机森林混淆矩阵
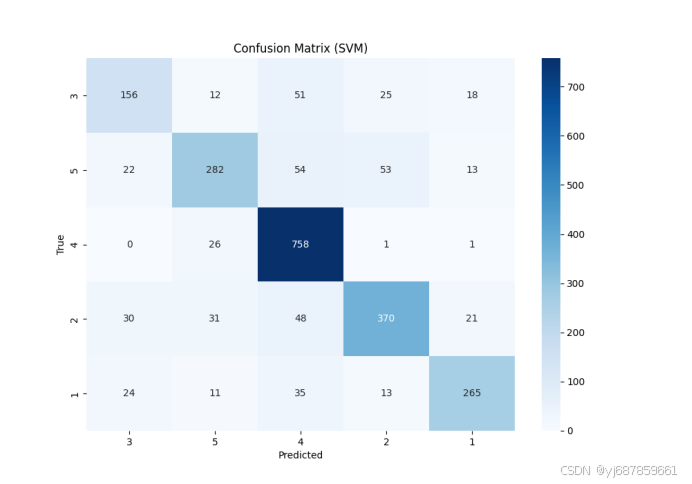
图3:SVM混淆矩阵
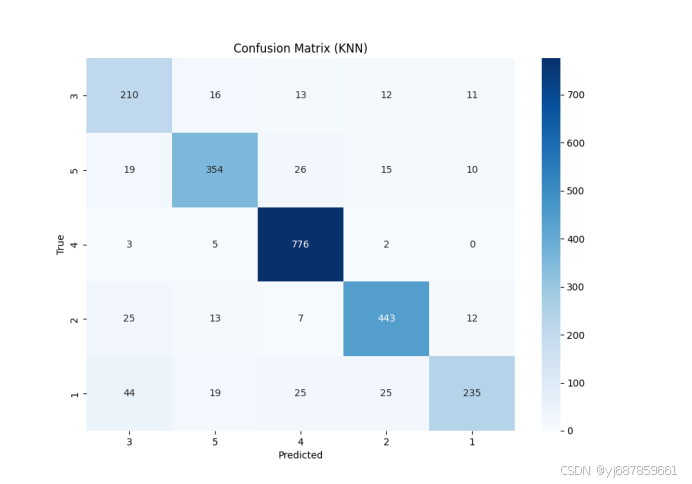
图4:KNN混淆矩阵

图5:梯度提升混淆矩阵
一、二问的代码展示如下:
import pandas as pd
from sklearn.model_selection import train_test_split
from sklearn.linear_model import LogisticRegression
from sklearn.ensemble import RandomForestClassifier, GradientBoostingClassifier
from sklearn.svm import SVC
from sklearn.neighbors import KNeighborsClassifier
from sklearn.metrics import accuracy_score, classification_report, confusion_matrix
from sklearn.preprocessing import StandardScaler
import warnings
import matplotlib.pyplot as plt
import seaborn as sns

# 加载数据
data = pd.read_csv('data.csv')

# 分离特征和标签
X = data.iloc[:, :-1]  # 特征
y = data.iloc[:, -1]  # 标签

# 分割数据集
X_train, X_test, y_train, y_test = train_test_split(X, y, test_size=0.2, random_state=42)

# 检查y_test的标签分布
unique_labels = y_test.unique()
if len(unique_labels) == 1:
    print(
        "Warning: All samples in the test set belong to the same class. Classification metrics may not be meaningful.")

# 数据标准化
scaler = StandardScaler()
X_train = scaler.fit_transform(X_train)
X_test = scaler.transform(X_test)

# 初始化模型
models = {
    'Logistic Regression': LogisticRegression(max_iter=20000),
    'Random Forest': RandomForestClassifier(n_estimators=100),
    'SVM': SVC(probability=True),
    'KNN': KNeighborsClassifier(n_neighbors=5),
    'Gradient Boosting': GradientBoostingClassifier(n_estimators=100)
}

# 忽略警告(可选,用于清理输出)
warnings.filterwarnings("ignore", category=RuntimeWarning)

# 训练模型并存储结果
results = {}
for name, model in models.items():
    model.fit(X_train, y_train)
    y_pred = model.predict(X_test)
    results[name] = {
        'accuracy': accuracy_score(y_test, y_pred),
        'classification_report': classification_report(y_test, y_pred, output_dict=True),
        'confusion_matrix': confusion_matrix(y_test, y_pred)
    }

# 提取并打印评价指标
for name, result in results.items():
    cr = result['classification_report']
    metrics = {}
    avg_types = ['macro avg', 'weighted avg']  # 总是存在的平均类型
    for avg_type in avg_types:
        if avg_type in cr:
            metrics.update({
                f'{avg_type.replace(" ", "_").upper()}_R': cr[avg_type]['recall'],
                f'{avg_type.replace(" ", "_").upper()}_P': cr[avg_type]['precision'],
                f'{avg_type.replace(" ", "_").upper()}_F1': cr[avg_type]['f1-score'],
            })
    # 添加准确率到metrics字典中
    metrics['ACCURACY'] = result['accuracy']

    print(f"{name} Metrics:")
    for metric, value in metrics.items():
        # 格式化输出,保留4位小数
        print_format = '.4f' if metric == 'ACCURACY' else '.4f'
        print(f"  {metric}: {value:{print_format}}")

# 通用函数来绘制混淆矩阵
def plot_confusion_matrix(name, cm, labels):
    plt.figure(figsize=(10, 7))
    sns.heatmap(cm, annot=True, fmt='d', cmap='Blues', xticklabels=labels, yticklabels=labels)
    plt.xlabel('Predicted')
    plt.ylabel('True')
    plt.title(f'Confusion Matrix ({name})')
    plt.show()

# 绘制混淆矩阵(仅对存在的模型)
for name, result in results.items():
    if 'confusion_matrix' in result:
        plot_confusion_matrix(name, result['confusion_matrix'], y_test.unique())
    else:
        print(f"Confusion matrix for model {name} not available.")
对于问题三
我们需要对数据集进行扩充。我们将使用SMOTE(Synthetic Minority Over-sampling Technique)来进行过采样。SMOTE 通过合成新的样本来增加少数类样本的数量,从而帮助缓解类别不平衡问题。以下是经过采样后得到相应的准确率、宏召回率、微召回率、宏精确率、微精确率、宏F1分数、微F1分数,并做出表格如下:
表2:多种模型各指标表(SMOTE版)
| 模型 | Acc | micro_p | macro_p | micro_r | macro_r | micro_f1 | macro_f1 |
| 逻辑回归 | 0.8608 | 0.8624 | 0.8411 | 0.8608 | 0.8384 | 0.8605 | 0.8383 |
| 随机森林 | 0.9483 | 0.9499 | 0.9339 | 0.9483 | 0.9413 | 0.9485 | 0.9374 |
| SVM | 0.7987 | 0.8161 | 0.7812 | 0.7987 | 0.7833 | 0.8021 | 0.7760 |
| 梯度提升 | 0.9280 | 0.9342 | 0.9201 | 0.9342 | 0.9133 | 0.9342 | 0.8421 |
| KNN | 0.8819 | 0.9290 | 0.9156 | 0.9280 | 0.9175 | 0.9280 | 0.9159 |

图6:逻辑回归混淆矩阵(SMOTE版)
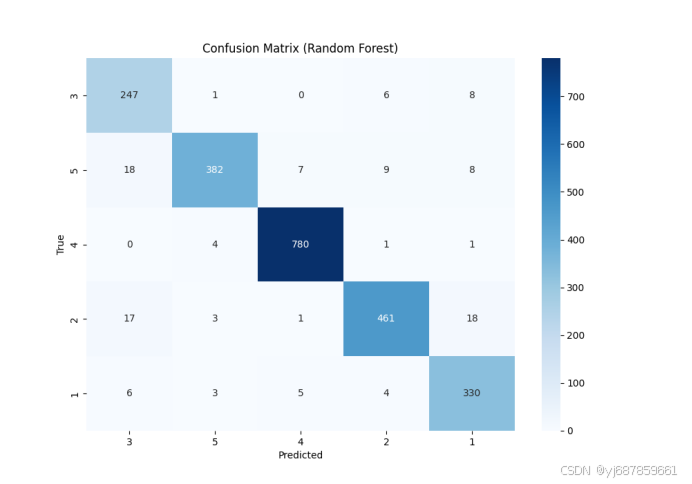
图7:随机森林混淆矩阵(SMOTE版)
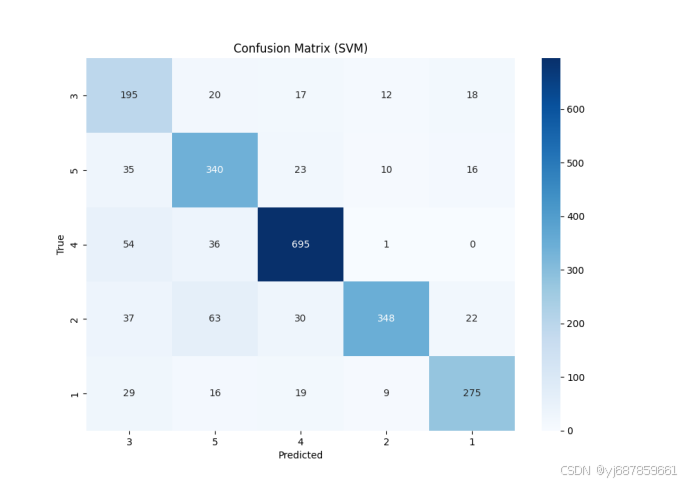
图8:SVM混淆矩阵(SMOTE版)

图9:KNN混淆矩阵(SMOTE版)
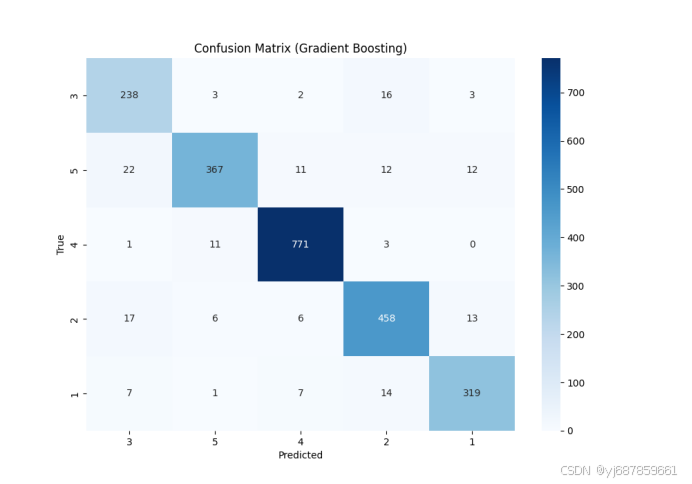
图10:梯度提升混淆矩阵(SMOTE版)
第三问的的代码如下:
import pandas as pd
from sklearn.model_selection import train_test_split
from sklearn.linear_model import LogisticRegression
from sklearn.ensemble import RandomForestClassifier, GradientBoostingClassifier
from sklearn.svm import SVC
from sklearn.neighbors import KNeighborsClassifier
from sklearn.metrics import accuracy_score, classification_report, confusion_matrix
from sklearn.preprocessing import StandardScaler
from imblearn.over_sampling import SMOTE
import warnings
import matplotlib.pyplot as plt
import seaborn as sns

# 加载数据
data = pd.read_csv('feature_vectors_syscallsbinders_frequency_5_Cat.csv')  # 注意文件路径

# 分离特征和标签
X = data.iloc[:, :-1]  # 特征
y = data.iloc[:, -1]  # 标签

# 分割数据集
X_train, X_test, y_train, y_test = train_test_split(X, y, test_size=0.2, random_state=42)

# 检查y_test的标签分布
unique_labels = y_test.unique()
if len(unique_labels) == 1:
    print(
        "Warning: All samples in the test set belong to the same class. Classification metrics may not be meaningful.")

# 数据标准化
scaler = StandardScaler()
X_train = scaler.fit_transform(X_train)
X_test = scaler.transform(X_test)

# 使用SMOTE进行过采样
smote = SMOTE(random_state=42)
X_resampled, y_resampled = smote.fit_resample(X_train, y_train)

# 初始化模型
models = {
    'Logistic Regression': LogisticRegression(max_iter=20000),
    'Random Forest': RandomForestClassifier(n_estimators=100),
    'SVM': SVC(probability=True),
    'KNN': KNeighborsClassifier(n_neighbors=5),
    'Gradient Boosting': GradientBoostingClassifier(n_estimators=100)
}

# 忽略警告(可选,用于清理输出)
warnings.filterwarnings("ignore", category=RuntimeWarning)

# 训练模型并存储结果
results = {}
for name, model in models.items():
    model.fit(X_resampled, y_resampled)  # 使用扩充后的数据进行训练
    y_pred = model.predict(X_test)
    results[name] = {
        'accuracy': accuracy_score(y_test, y_pred),
        'classification_report': classification_report(y_test, y_pred, output_dict=True),
        'confusion_matrix': confusion_matrix(y_test, y_pred)
    }

# 提取并打印评价指标
for name, result in results.items():
    cr = result['classification_report']
    metrics = {}
    avg_types = ['macro avg', 'weighted avg']  # 总是存在的平均类型
    for avg_type in avg_types:
        if avg_type in cr:
            metrics.update({
                f'{avg_type.replace(" ", "_").upper()}_R': cr[avg_type]['recall'],
                f'{avg_type.replace(" ", "_").upper()}_P': cr[avg_type]['precision'],
                f'{avg_type.replace(" ", "_").upper()}_F1': cr[avg_type]['f1-score'],
            })
    # 添加准确率到metrics字典中
    metrics['ACCURACY'] = result['accuracy']

    print(f"{name} Metrics:")
    for metric, value in metrics.items():
        # 格式化输出,如果是准确率则保留4位小数,否则保留2位小数(根据需要调整)
        print_format = '.4f' if metric == 'ACCURACY' else '.2f'
        print(f"  {metric}: {value:{print_format}}")

# 通用函数来绘制混淆矩阵
def plot_confusion_matrix(name, cm, labels):
    plt.figure(figsize=(10, 7))
    sns.heatmap(cm, annot=True, fmt='d', cmap='Blues', xticklabels=labels, yticklabels=labels)
    plt.xlabel('Predicted')
    plt.ylabel('True')
    plt.title(f'Confusion Matrix ({name})')
    plt.show()

# 绘制混淆矩阵(仅对存在的模型)
for name, result in results.items():
    if 'confusion_matrix' in result:
        plot_confusion_matrix(name, result['confusion_matrix'], y_test.unique())
    else:
        print(f"Confusion matrix for model {name} not available.")
对于问题四
我们使用PCA对数据进行降维,选择了50个主成分,使用降维后的数据重新训练了所有模型。计算并打印了降维后模型的性能指标。绘制了降维后模型的混淆矩阵。通过修改后的代码,我们可以对少数类样本进行过采样,从而改善模型在处理不平衡数据集时的性能。
表3:多种模型各指标表(SMOTE+PCA版)
| 模型 | Acc | micro_p | macro_p | micro_r | macro_r | micro_f1 | macro_f1 |
| 逻辑回归 | 0.7392 | 0.7522 | 0.7176 | 0.7392 | 0.7085 | 0.7387 | 0.7046 |
| 随机森林 | 0.9159 | 0.9190 | 0.8938 | 0.9159 | 0.8980 | 0.9167 | 0.8950 |
| SVM | 0.7685 | 0.7851 | 0.7594 | 0.7685 | 0.7401 | 0.7668 | 0.7396 |
| 梯度提升 | 0.8776 | 0.8806 | 0.8518 | 0.8776 | 0.8560 | 0.8783 | 0.8527 |
| KNN | 0.8871 | 0.8902 | 0.8617 | 0.9280 | 0.8624 | 0.8874 | 0.8602 |
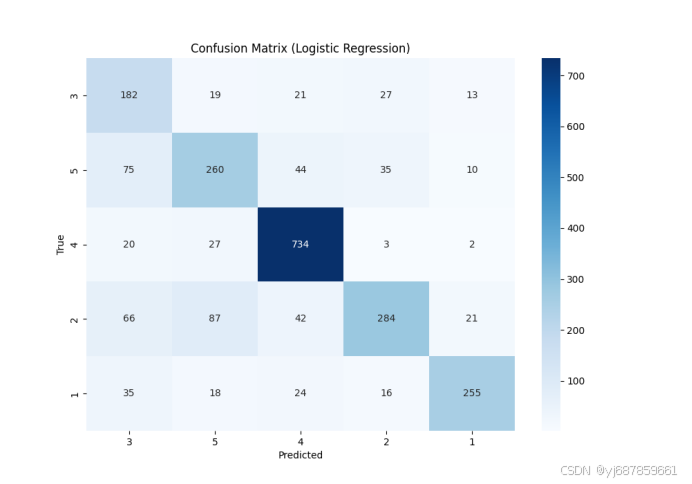
图11:逻辑回归混淆矩阵(SMOTE+PCA版)
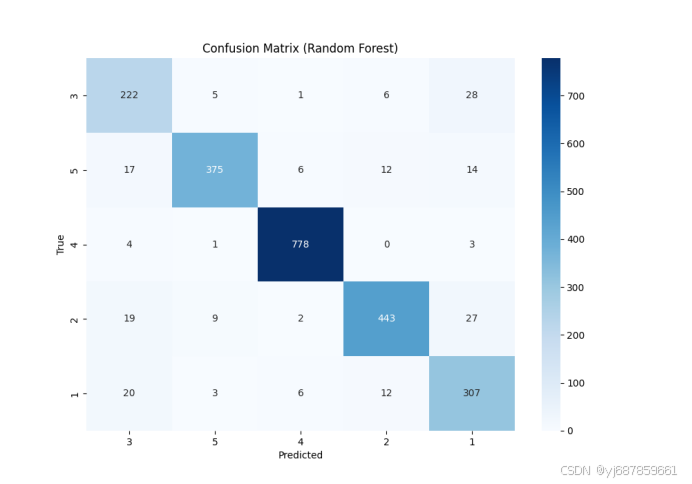
图12:随机森林混淆矩阵(SMOTE+PCA版)
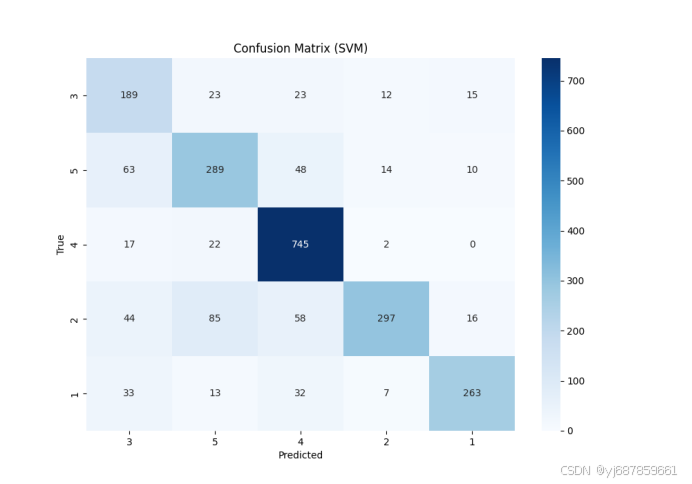
图13:SVM混淆矩阵(SMOTE+PCA版)
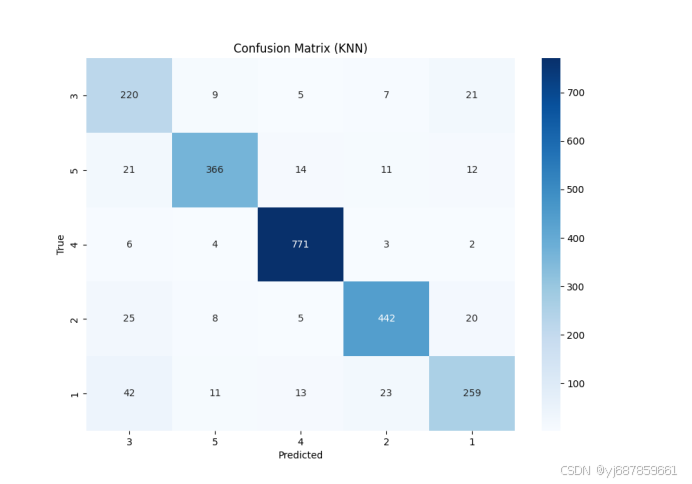
图14:KNN混淆矩阵(SMOTE+PCA版)
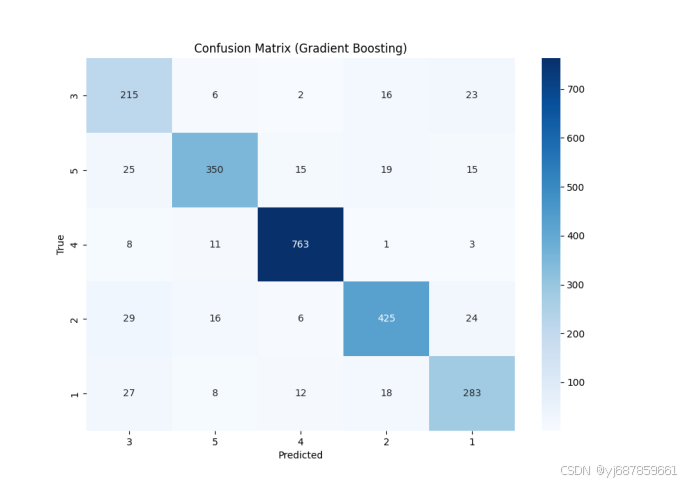
图15:梯度提升混淆矩阵(SMOTE+PCA版)
第四问的代码如下:
import pandas as pd
from sklearn.model_selection import train_test_split
from sklearn.linear_model import LogisticRegression
from sklearn.ensemble import RandomForestClassifier, GradientBoostingClassifier
from sklearn.svm import SVC
from sklearn.neighbors import KNeighborsClassifier
from sklearn.metrics import accuracy_score, classification_report, confusion_matrix
from sklearn.preprocessing import StandardScaler
from imblearn.over_sampling import SMOTE
from sklearn.decomposition import PCA
import warnings
import matplotlib.pyplot as plt
import seaborn as sns

# 加载数据
data = pd.read_csv('data.csv')  # 注意文件路径

# 分离特征和标签
X = data.iloc[:, :-1]  # 特征
y = data.iloc[:, -1]  # 标签

# 分割数据集
X_train, X_test, y_train, y_test = train_test_split(X, y, test_size=0.2, random_state=42)

# 检查y_test的标签分布
unique_labels = y_test.unique()
if len(unique_labels) == 1:
    print(
        "Warning: All samples in the test set belong to the same class. Classification metrics may not be meaningful.")

# 数据标准化
scaler = StandardScaler()
X_train = scaler.fit_transform(X_train)
X_test = scaler.transform(X_test)

# 使用SMOTE进行过采样
smote = SMOTE(random_state=42)
X_resampled, y_resampled = smote.fit_resample(X_train, y_train)

# PCA降维
pca = PCA(n_components=50)  # 假设我们选择50个主成分,这个值可以根据实际情况调整
X_resampled_pca = pca.fit_transform(X_resampled)
X_test_pca = pca.transform(X_test)

# 初始化模型
models = {
    'Logistic Regression': LogisticRegression(max_iter=20000),
    'Random Forest': RandomForestClassifier(n_estimators=100),
    'SVM': SVC(probability=True),
    'KNN': KNeighborsClassifier(n_neighbors=5),
    'Gradient Boosting': GradientBoostingClassifier(n_estimators=100)
}

# 忽略警告(可选,用于清理输出)
warnings.filterwarnings("ignore", category=RuntimeWarning)

# 训练模型并存储结果
results_pca = {}
for name, model in models.items():
    model.fit(X_resampled_pca, y_resampled)  # 使用降维后的数据进行训练
    y_pred = model.predict(X_test_pca)
    results_pca[name] = {
        'accuracy': accuracy_score(y_test, y_pred),
        'classification_report': classification_report(y_test, y_pred, output_dict=True),
        'confusion_matrix': confusion_matrix(y_test, y_pred)
    }

# 提取并打印评价指标
for name, result in results_pca.items():
    cr = result['classification_report']
    metrics = {}
    avg_types = ['macro avg', 'weighted avg']  # 总是存在的平均类型
    for avg_type in avg_types:
        if avg_type in cr:
            metrics.update({
                f'{avg_type.replace(" ", "_").upper()}_R': cr[avg_type]['recall'],
                f'{avg_type.replace(" ", "_").upper()}_P': cr[avg_type]['precision'],
                f'{avg_type.replace(" ", "_").upper()}_F1': cr[avg_type]['f1-score'],
            })
    # 添加准确率到metrics字典中
    metrics['ACCURACY'] = result['accuracy']

    print(f"{name} Metrics after PCA:")
    for metric, value in metrics.items():
        # 格式化输出保留4位小数
        print_format = '.4f'
        print(f"  {metric}: {value:{print_format}}")

# 通用函数来绘制混淆矩阵
def plot_confusion_matrix(name, cm, labels):
    plt.figure(figsize=(10, 7))
    sns.heatmap(cm, annot=True, fmt='d', cmap='Blues', xticklabels=labels, yticklabels=labels)
    plt.xlabel('Predicted')
    plt.ylabel('True')
    plt.title(f'Confusion Matrix ({name})')
    plt.show()

# 绘制混淆矩阵(仅对存在的模型)
for name, result in results_pca.items():
    if 'confusion_matrix' in result:
        plot_confusion_matrix(name, result['confusion_matrix'], y_test.unique())
    else:
        print(f"Confusion matrix for model {name} not available.")


 5224
5224

 被折叠的 条评论
为什么被折叠?
被折叠的 条评论
为什么被折叠?
 到【灌水乐园】发言


