


目录
报错:Extra alignment tab has been changed to \cr.
表格和表格之间有大片空白
用longtable
报错:Extra alignment tab has been changed to \cr.
表格的列不一致,看看是哪里多了列
跨页表格
\usepackage{longtable}

\begin{longtable}{|c|p{0.9\columnwidth}|}
\caption{表题}\label{标签}\\ \hline
\textbf{列标题} & \multicolumn{1}{|c|}{\textbf{列标题}} \\ \hline
{xxx} & {xxx} \\ \hline
{xxx} & {xxx} \\ \hline
{xxx} & {xxx} \\ \hline
\end{longtable}
双栏排版表格跨栏
加*号
\begin{table*}
...
\end{table*}
横版表格
\begin{sidewaystable}[thp]
	\caption{This is the caption}
	\centering
	\begin{tabular}{|c|c|c|c|}
		\hline
		.......
	\end{tabular}
\end{sidewaystable}
横版表格不要放到最后一页
\clearpage
\newpage
\begin{sidewaystable}
......
\end{sidewaystable}
\clearpage
表格整体尺寸修改
\resizebox{列宽}{行高}{
...
}
列宽、行高可以为数值(如50mm),也可以根据文字调整(如\textwidth指自适应文字宽度)
表格内文字居中
\begin{tabular}{c}
c还可以替换为l或r,对应左对齐、右对齐
表格内文字自动换行
网上有多种方法。我用的是以下方法:
\begin{tabular}{|p{0.3\columnwidth}|p{0.6\columnwidth}|}
里面的数值根据需要调整
也见到过用
\begin{tabular}{|p{0.3\columnwidth}|p{0.6\columnwidth}|}
\hline
\parbox[c]{3.6cm}{xxxxxxxxxxx} &
\parbox[c]{7.2cm}{xxxxxxxxxx} \\
表格位置的!htbp参数
! 表示忽略“美学”标准
h (here)表示将表格排在当前文字位置
t (top) 表示将表格放在下一页的页首
b (bottom) 表示将表格放在当前页的底部
p (浮动页) 表示将表格放在允许有浮动对象的页面上
插入图片
\begin{figure}[htbp]
\centering
\includegraphics[width=8cm]{images/fig1}
\caption{图的说明}
\end{figure}
如果要双栏也是加*
includegraphics参数如下
includegraphics Options
| height 图形的高度(可为任何 TEX 度量单位)。 totalheight 图形的全部高度,可为任何 TEX 度量单位( 6/95 增加)。 width 图形的宽度(可为任何 TEX 度量单位)。 scale 图形的缩放因子,设定 scale=2 会使 插入的图形的大小为其自然大小的两倍。 angle 设定旋转的角度,以度为单位,顺时钟方向为正。 origin origin 指定图形绕那一点旋转,缺省 是图形的参考点(12/95 增加)。初始点有可能与 第 8.3节的 \rotatebox 命令中的一样。 比如 origin=c 将使图形绕它的中心旋转。 bb 设定 BoundingBox 的值。 bb=10 20 100 200 设定 BoundingBox 的左下角在 (10,20),右上角在 (100,200)。因为 \includegraphics 会自动从 EPS 文件中读入 BoundingBox 行 所给的值,所以一般不使用 bb 这个选项。但它在 EPS 文件 中的 BoundingBox 丢失或出错时还是很有用的 |
includegraphics Cropping Options
| viewpoint 指定图形可以被看到的部分。如同 BoundingBox 一样, 这是一个由四个数字,左下角和右上角的坐标所确定的区域。 这里的坐标是相对于 BoundingBox 的左下角的(6/95 增加)。 例如,如果图形的 BoundingBox 的值是 50 50 410 302, viewpoint=50 50 122 122 将显示以图形的左下角为左下角的一英寸大小的区域。 而 viewpoint=338 230 410 302 则会显示以图形的 右上角为右上角的一英寸大小的区域。 必须使用 clip 选项(见表 7.3) 来阻止显示视图以外的图形部分 。 trim 指定图形可以被看到的部分的另一选项。所给出的四个数字 分别代表了从左、下、右、上被截去的值。正数代表从此方向 截去的大小,而负数则代表从此方向加上的大小。 |
includegraphics Boolean Options
| noclip (缺省选项)显示整个的图形,即使有些部分在视图之外。 clip 当使用 clip 时,将不显示图形在视图之外的部分。 draft 当使用 draft 选项时,将只显示图形的 BoundingBox 和文件名,这使得显示和打印文档的速度加快。如果使用 draft 宏包选项,\usepackage[draft]{graphicx} 会导致文档中的所有图形都被以草稿(draft)方式插入。 final (缺省选项,除非使用\usepackage[draft]{graphicx}) final 选项使得图形被显示,经常用来覆盖 \usepackage[draft]{graphicx} keepaspectratio 在没有设定 keepaspectratio 选项时, 给定图形的高度(全部高度)和宽度会导致图形被不对称缩 放来满足所设定的高和宽。在设定 keepaspectratio 选项后,给定图形的高度(全部高度)和宽度时,图形会 保持原有的宽高比例,尽可能使得图形满足所设定的高和宽, 但是图形不会超出其中任一个。 |
也可以用pgfplots包
\usepackage{pgfplots}
我需要画的是柱状图,因此只截取柱状图的说明过来。
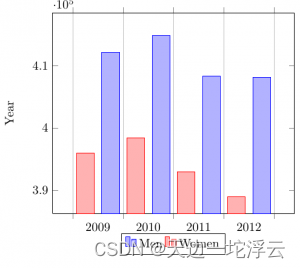
Bar graphs
Bar graphs (also known as bar charts and bar plots) are used to display gathered data, mainly statistical data about a population of some sort. Bar plots in pgfplots are highly customisable, but here we are going to show an example that 'just works':
bar graph
\begin{tikzpicture}
\begin{axis}[
	x tick label style={
		/pgf/number format/1000 sep=},
	ylabel=Year,
	enlargelimits=0.05,
	legend style={at={(0.5,-0.1)},
	anchor=north,legend columns=-1},
	ybar interval=0.7,
]
\addplot
	coordinates {(2012,408184) (2011,408348)
		 (2010,414870) (2009,412156) (2008,415 838)};
\addplot
	coordinates {(2012,388950) (2011,393007)
		(2010,398449) (2009,395972) (2008,398866)};
\legend{Men,Women}
\end{axis}
\end{tikzpicture}
Output
编辑
The figure starts with the already explained declaration of the tikzpicture and axis environments, but the axis declaration has a number of new parameters:
x tick label style={/pgf/number format/1000 sep=}
This piece of code defines a complete style for the plot. With this style you may include several \addplot commands within this axis environment, they will fit and look nice together with no further tweaks (the ybar parameter described below is mandatory for this to work).
enlargelimits=0.05.
Enlarging the limits in a bar plot is necessary because these kind of plots often require some extra space above the bar to look better and/or add a label. Then number 0.05 is relative to the total height of of the plot.
legend style={at={(0.5,-0.2)}, anchor=north,legend columns=-1}
Again, this will work just fine most of the time. If anything, change the value of -0.2 to locate the legend closer/farther from the x-axis.
ybar interval=0.7,
Thickness of each bar. 1 meaning the bars will be one next to the other with no gaps and 0 meaning there will be no bars, but only vertical lines.
The coordinates in this kind of plot determine the base point of the bar and its height.
The labels on the y-axis will show up to 4 digits. If in the numbers you are working with are greater than 9999 pgfplot will use the same notation as in the example.
两张图片并排放置
\begin{figure}[h]
    \centering
    \subfigure[xxx]{
        \centering
        \includegraphics[width=0.4\linewidth]{fig1.png}
        \label{fig1}}~~\hfill~
    \subfigure[xxx]{
        \centering
        \includegraphics[width=0.6\linewidth]{fig2.png}
        \label{fig2}}~~\hfill~
    \caption{xxx}
    \label{fig_tf_compute_sequence}
\end{figure}
两张图片上下两行放置
用subfigure
subfigure之间要空行,或者用\quad,不然就并排放了。
\usepackage{graphicx}
\usepackage{subfigure}

\begin{figure}[htbp]
\centering
\subfigure[pic1.]{
\includegraphics[width=5.5cm]{pic1.png}
}
\quad
\subfigure[pic2.]{
\includegraphics[width=5.5cm]{pic2.png}
}
\caption{ pics}
\end{figure}


 9203
9203


 被折叠的 条评论
为什么被折叠?
被折叠的 条评论
为什么被折叠?
 到【灌水乐园】发言


