


可用于应用监控的系统有很多,有的需要埋点(切面)、有的需要配置Agent(字节码增强)。现在使用另外一个监控系统 —— Grafana。
Grafana 监控面板

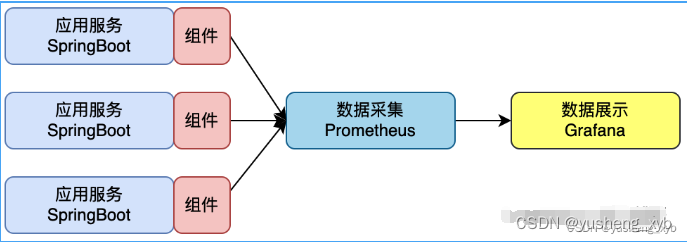
这套监控主要用到了 SpringBoot Actuator + Prometheus + Grafana 三个模块组合的起来使用的监控。非常轻量好扩展使用。
-
Actuator - 数据上报、Prometheus - 数据采集、Grafana - 数据展示
-
本章节的内容主要为代码中的配置和监控的配置。
环境配置
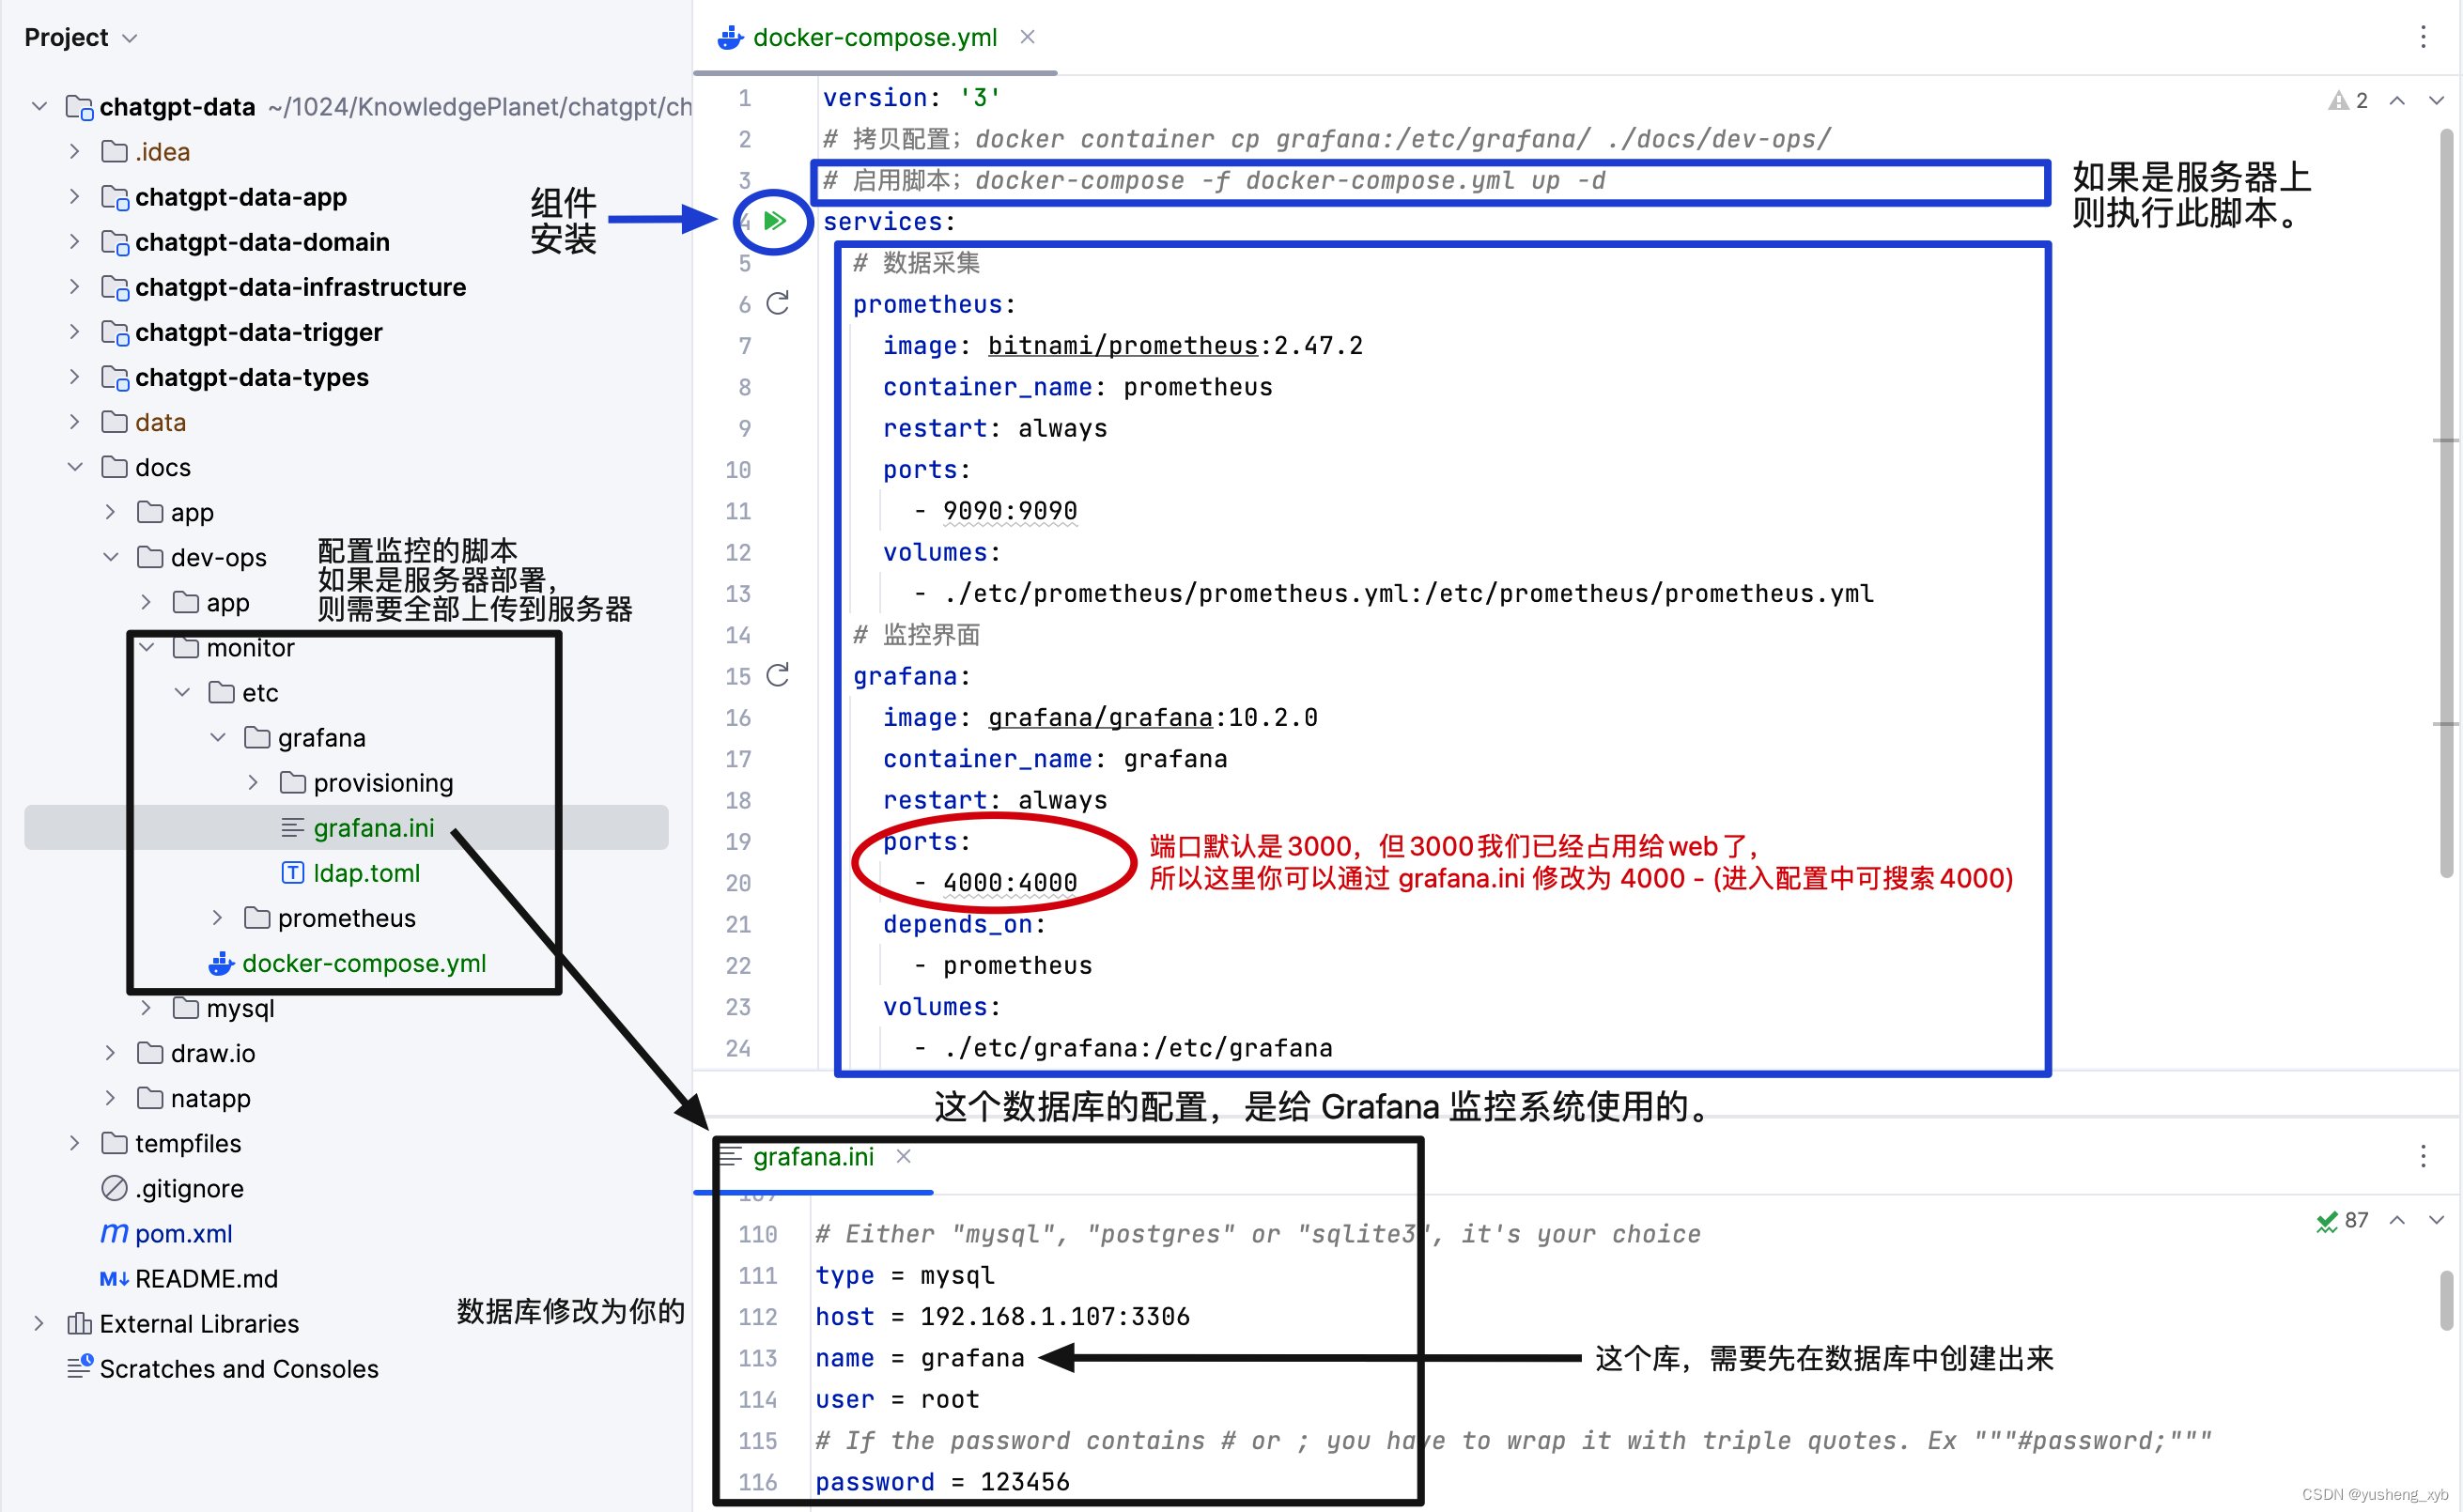
本节所需的监控配置,已经放到了 chatgpt-data 的 dev-ops 包下了。你只需要确保本地或者云服务器已经安装了Docker,那么就可以执行安装了。
1. Grafana.ini
这一部分是小傅哥通过第一次默认安装后,再通过 docker 脚本 docker container cp grafana:/etc/grafana/ ./docs/dev-ops/ 从容器中拷贝下来的配置。因为我们需要做一些默认的配置处理。
端口修改
# The http port to use
http_port = 4000
-
Grafana 默认配置的是 3000 端口,但这个端口很多时候都被占用了。所以如果你的也占用了,那么可以在这里修改下。
连接配置
[database]
# You can configure the database connection by specifying type, host, name, user and password
# as separate properties or as on string using the url properties.
# Either "mysql", "postgres" or "sqlite3", it's your choice
type = mysql
host = host.docker.internal:3306
name = grafana
user = root
# If the password contains # or ; you have to wrap it with triple quotes. Ex """#password;"""
password = 123456
-
为了让 Grafana 的配置具有迁移性,也不至于删除在安装就丢失配置,那么这里可以选择配置数据库进行使用。
-
注意;你需要先在本地安装MySQL以及创建出一个grafana数据库。—— 连接后,会自动建表。
注意:host那里设置localhost或者ipv4地址都连接失败,设置host.docker.internal成功,目前不知道原因
2. datasource.yml
apiVersion: 1
datasources:
- name: Prometheus
type: prometheus
access: proxy
isDefault: true
-
注意;因为 Grafana 使用的是 Prometheus 数据源,所以你需要在这里配置上。当然也可以不配置,在启动的 Grafana 线上进行配置。
3. prometheus.yml
global:
scrape_interval: 15s
scrape_configs:
- job_name: 'x-api-app'
metrics_path: '/actuator/prometheus'
static_configs:
- targets: [ '192.168.158.77:8080' ]
-
这里配置的是 prometheus.yml 对需要采集的 SpringBoot 应用访问地址。注意你需要替换为你的服务器IP和服务端口。
应用配置
POM 配置
chatgpt-data-app 模块下
<!-- 监控;actuator-上报、prometheus-采集、grafana-展示 -->
<dependency>
    <groupId>org.springframework.boot</groupId>
    <artifactId>spring-boot-starter-actuator</artifactId>
</dependency>
<dependency>
    <groupId>io.micrometer</groupId>
    <artifactId>micrometer-registry-prometheus</artifactId>
</dependency>
<dependency>
    <groupId>org.aspectj</groupId>
    <artifactId>aspectjweaver</artifactId>
</dependency>-
actuator、prometheus 是监控所需的内容,aspectjweaver 是本节需要使用 prometheus 添加自定义的埋点,而这个会用到切面。
chatgpt-data-trigger 模块下
<!-- 监控;actuator-上报、prometheus-采集、grafana-展示 -->
<dependency>
    <groupId>org.springframework.boot</groupId>
    <artifactId>spring-boot-starter-actuator</artifactId>
</dependency>
<dependency>
    <groupId>io.micrometer</groupId>
    <artifactId>micrometer-registry-prometheus</artifactId>
</dependency>
代码配置
1. 启动监听服务
@EnableAspectJAutoProxy
@Configuration
public class PrometheusConfiguration {

    @Bean
    public CollectorRegistry collectorRegistry() {
        return new CollectorRegistry();
    }

    @Bean
    public PrometheusMeterRegistry prometheusMeterRegistry(PrometheusConfig config, CollectorRegistry collectorRegistry) {
        return new PrometheusMeterRegistry(config, collectorRegistry, Clock.SYSTEM);
    }

    @Bean
    public TimedAspect timedAspect(MeterRegistry registry) {
        return new TimedAspect(registry);
    }

    @Bean
    public CountedAspect countedAspect(MeterRegistry registry) {
        return new CountedAspect(registry);
    }

}
2. 自定义监控埋点
@Timed(value = "no_pay_notify_order_job", description = "定时任务,订单支付状态更新")
    @Scheduled(cron = "0/3 * * * * ?")
    public void exec() {
    // ...
}-
你可以使用监控提供的注解,来对需要监控的方法进行埋点。@Timed 这样就可以采集到数据,在监控中配置了。
3. YML 配置
# 监控
management:
  endpoints:
    web:
      exposure:
        include: "*" # 暴露所有端点,包括自定义端点
  endpoint:
    metrics:
      enabled: true
    health:
      show-details: always # 显示详细的健康检查信息
  metrics:
    export:
      prometheus:
        enabled: true # 启用Prometheus
  prometheus:
    enabled: true # 启用Prometheus端点
  jmx:
    enabled: true # 启用JMX监控
  system:
    cpu:
      enabled: true # 启用CPU监控
    memory:
      enabled: true # 启用内存监控
可以访问 http://127.0.0.1:9090/service-discovery?search= - 查看采集数据。
监控配置
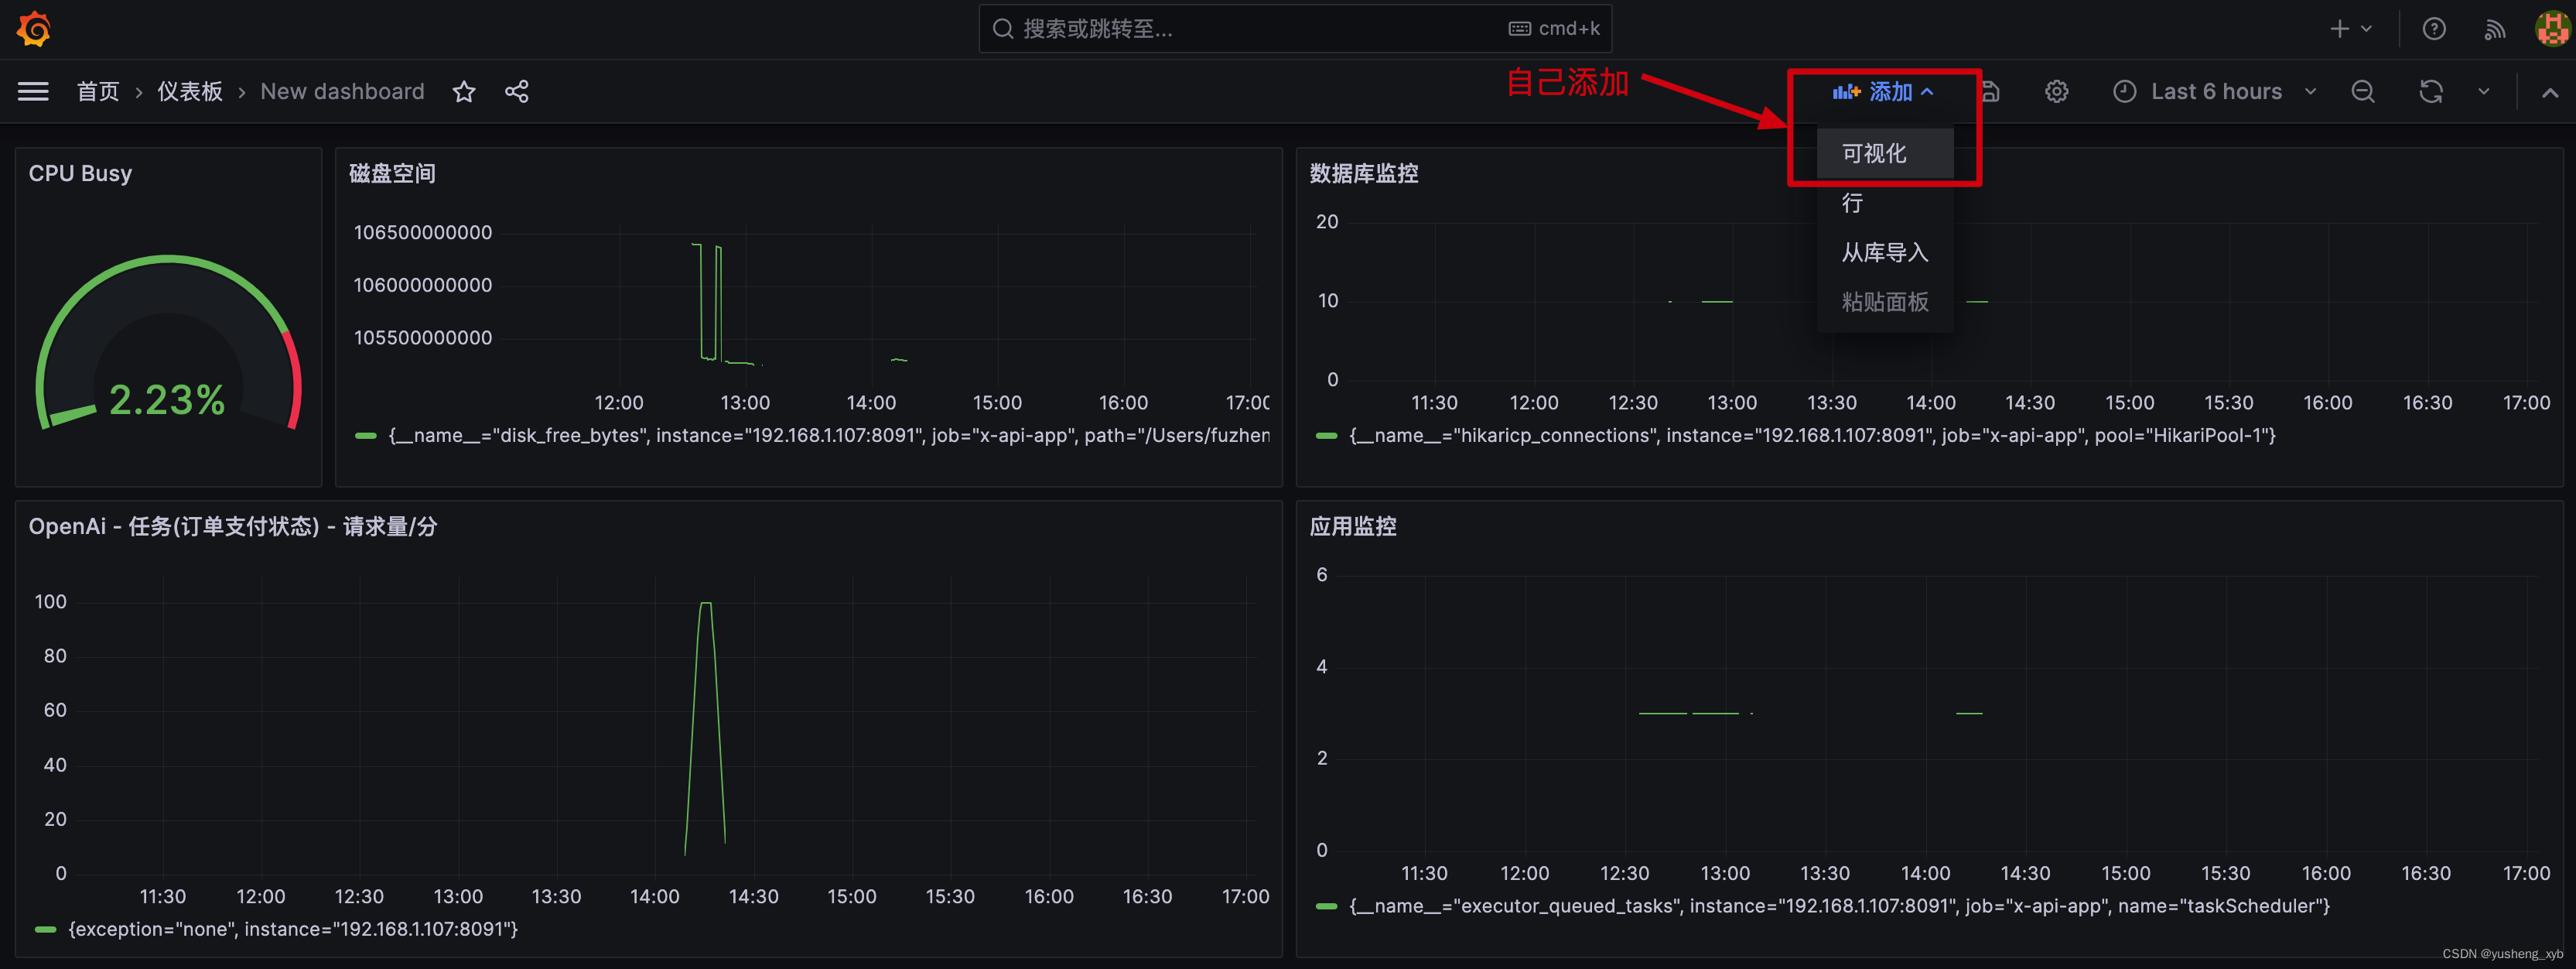
地址:http://127.0.0.1:4000/dashboards
介绍:Grafana 的监控,需要新建监控仪表。也可以使用导入功能。导入功能可以导入 Grafana 官网提供的各项模板,非常好用。
**常用代码**
4.1 CPU
sum(system_cpu_usage{job="x-api-app"}) / sum(system_cpu_count{job="x-api-app"}) * 100
4.2 磁盘
disk_free_bytes{job="x-api-app"}
4.3 连接池
hikaricp_connections{pool="HikariPool-1", job="x-api-app"}
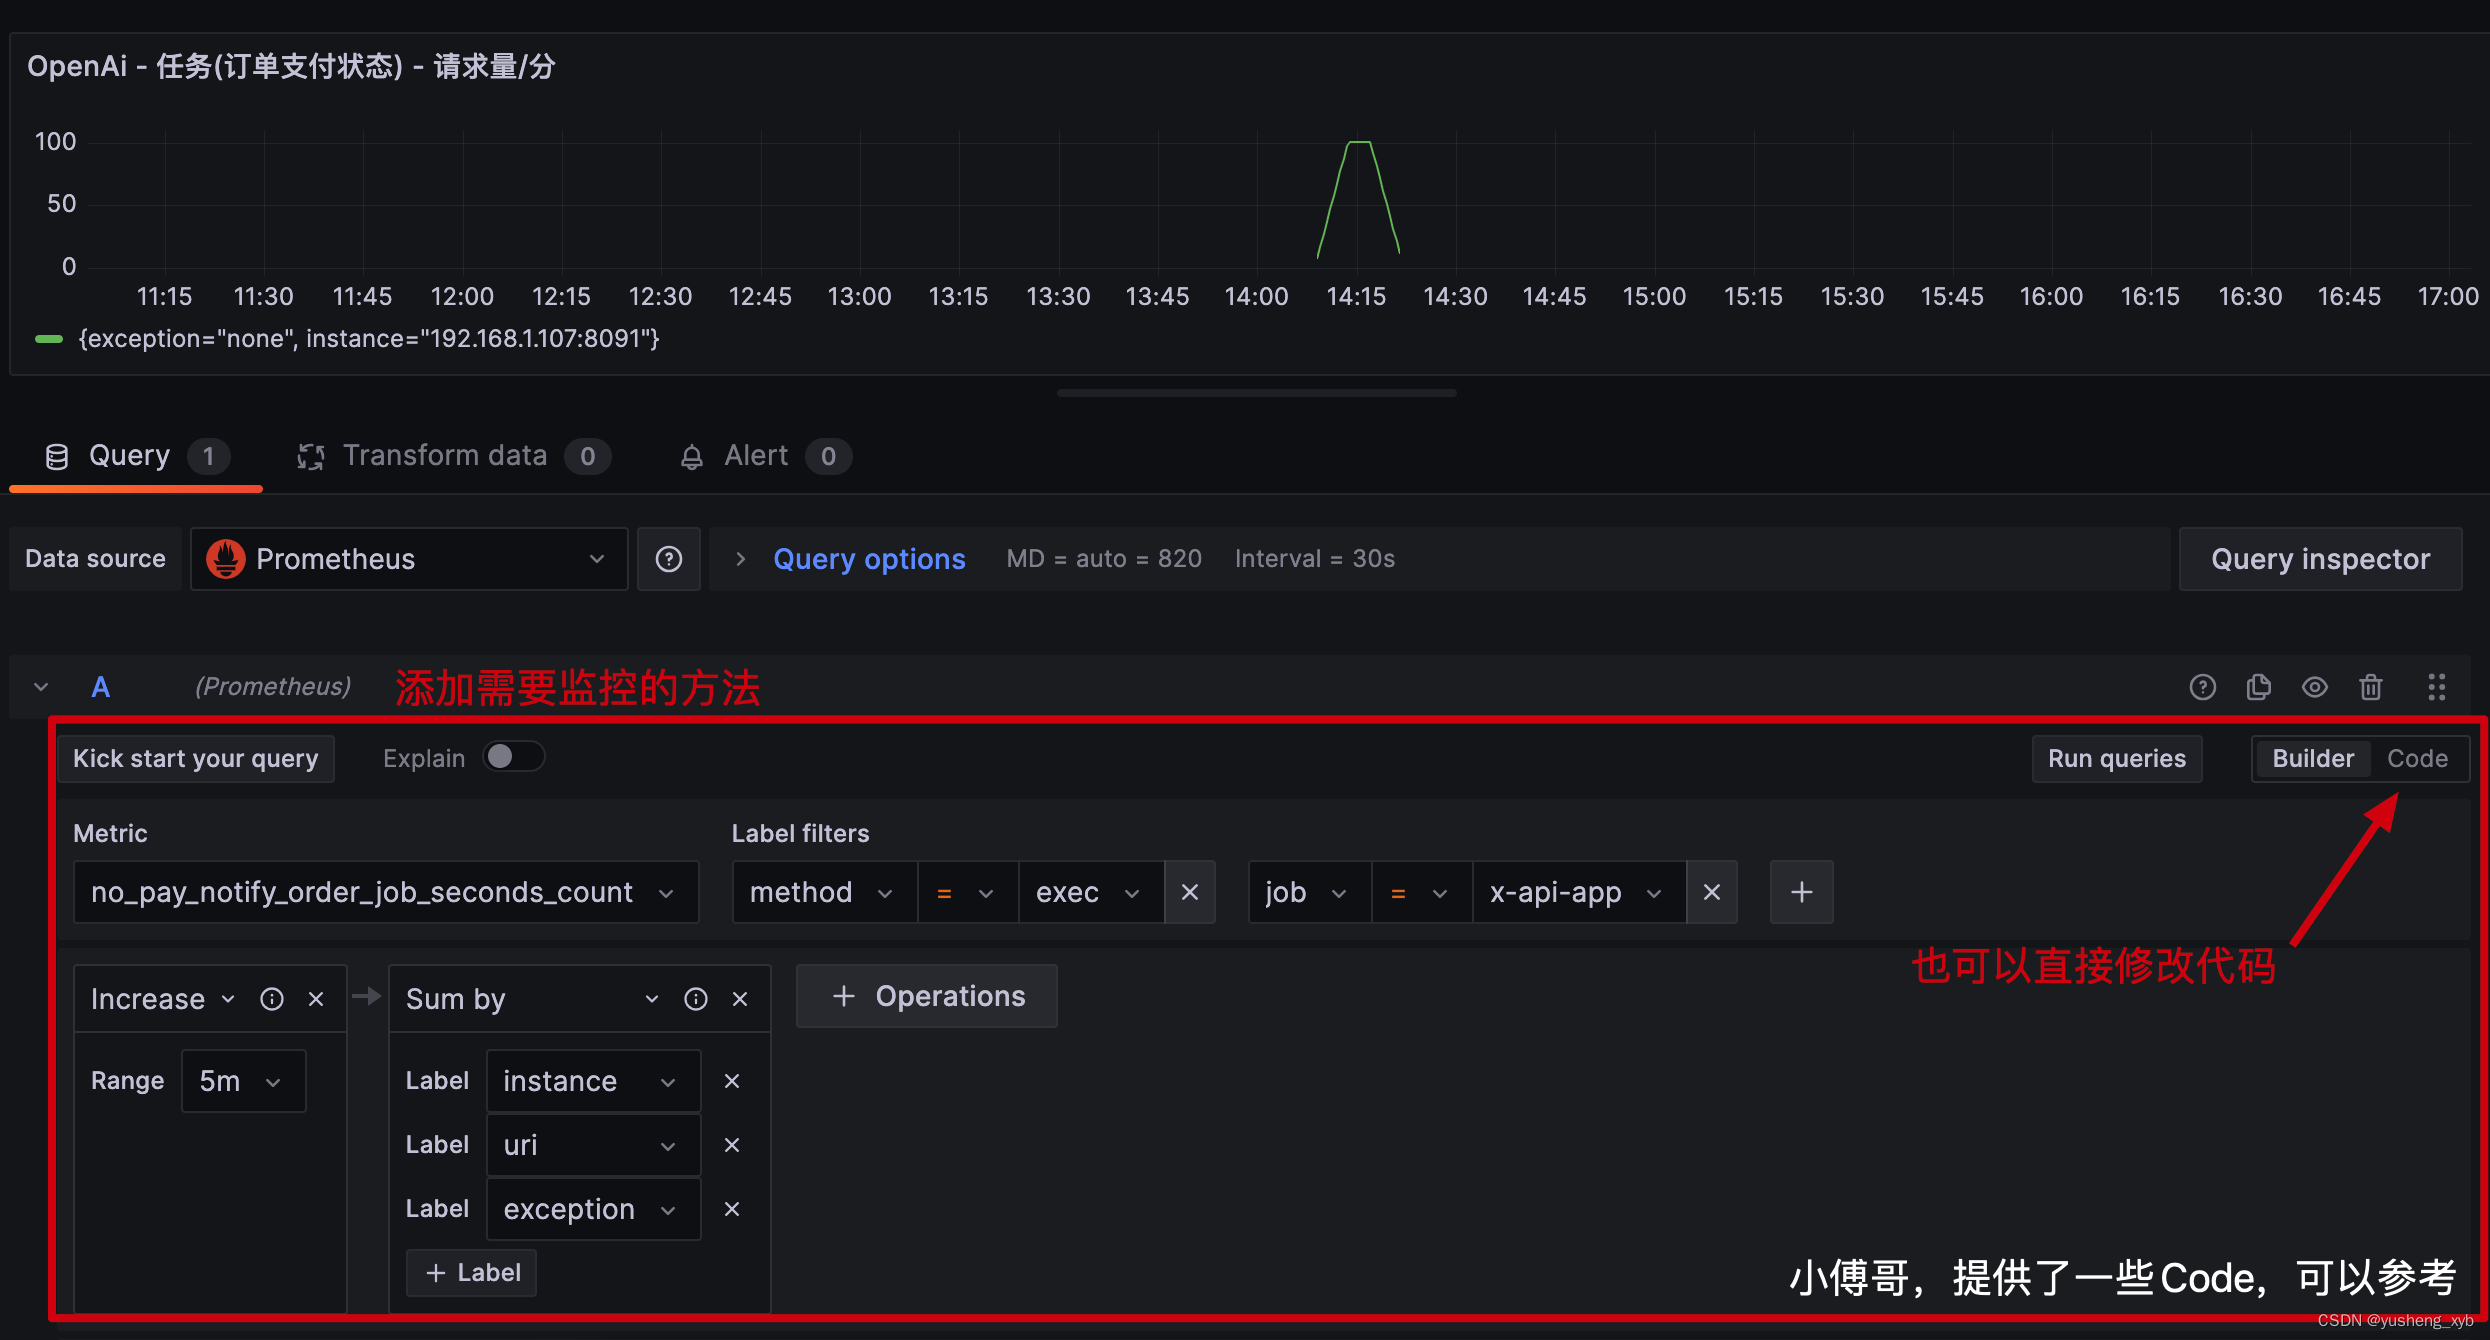
4.4 请求量
sum by(instance, uri, exception) (increase(no_pay_notify_order_job_seconds_count{method="exec", job="x-api-app"}[5m]))
4.5 响应时间
sum by (uri) (increase(http_server_requests_seconds_sum{uri=~"/api/v1/chatgpt/chat/completions"}[1m]))
/sum by (uri) (increase(http_server_requests_seconds_count{uri=~"/api/v1/chatgpt/chat/completions"}[1m]))


 1万+
1万+

 被折叠的 条评论
为什么被折叠?
被折叠的 条评论
为什么被折叠?
 到【灌水乐园】发言


