The following steps outline how to enable a sql level trace and FND logging when submitting a concurrent program.
These steps utilize SQL Developer.
SQL Developer can be downloaded from the following location for free and is recommended:
http://www.oracle.com/technology/software/products/sql/index.html
1. The following profile options will need to be set in order to enable the Debug Options button in the Concurrent Request Submission form: Profile - Concurrent: Allow Debugging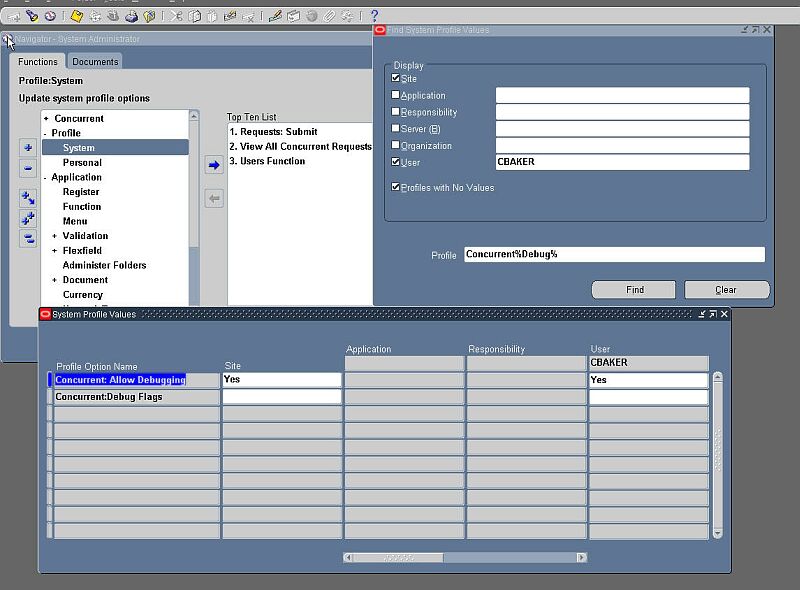
2. Next, proceed to the Concurrent Request Submission form to submit the concurrent program in question.
- Select the Single Request - and input all parameters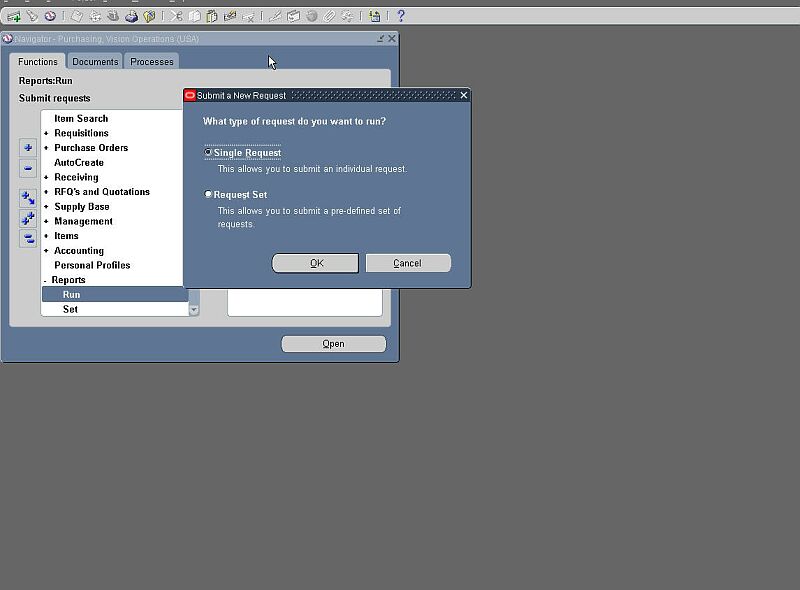
Rather than submitting the request, choose the 'Debug Options' button now enabled in the submission form.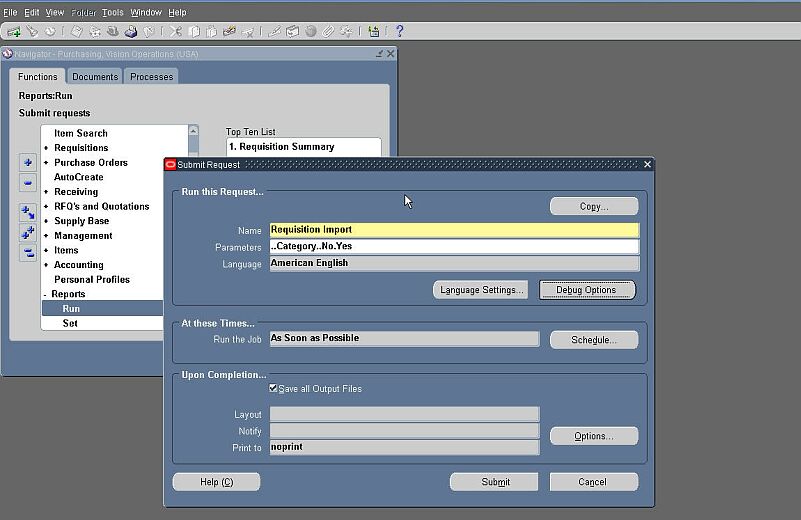
Rather than submitting the request, choose the 'Debug Options' button now enabled in the submission form.
3. In the web based form that opens, choose the options as seen below to enable trace and FND logging.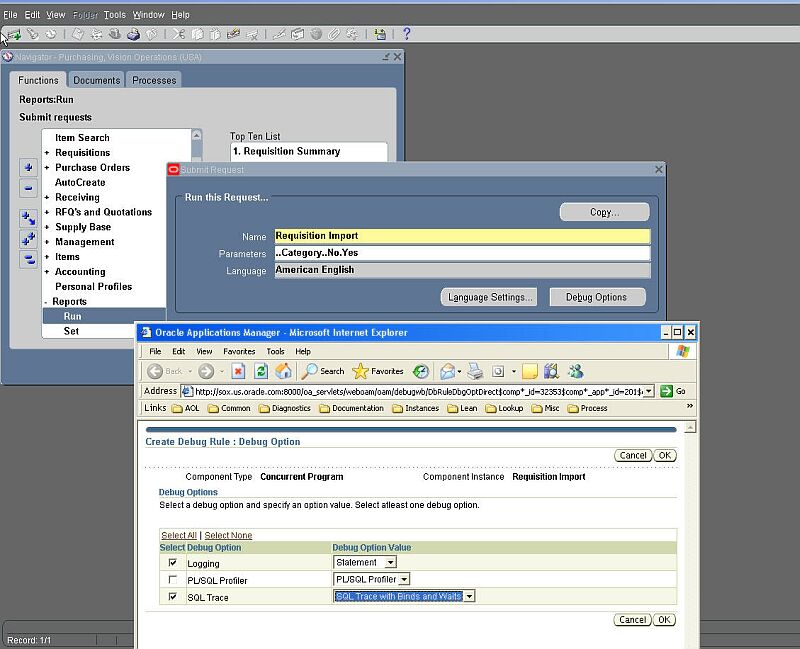
Upon selecting the options, choose the OK button off to the right.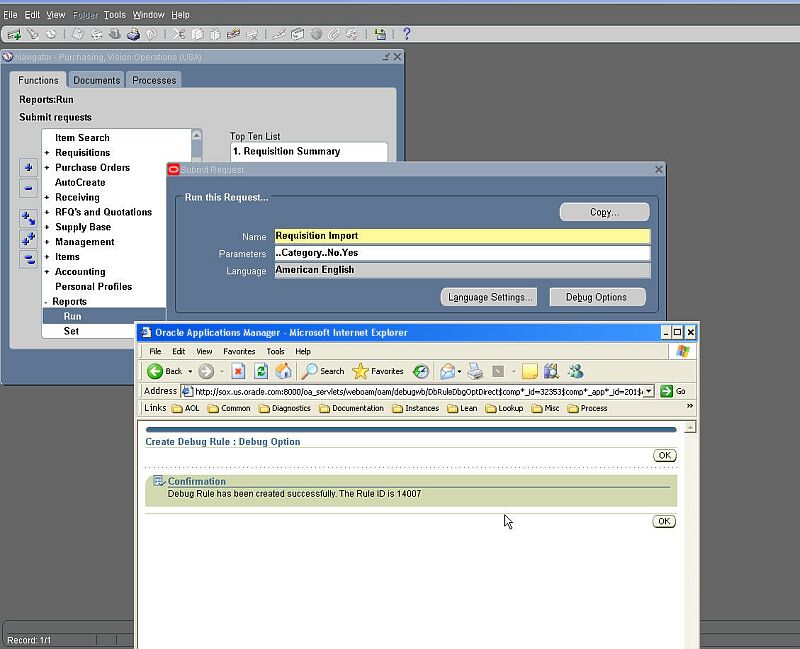
A new screen will appear showing that the rule was created, choose the OK button which closes the window.
4. Do Not submit the concurrent request yet, but instead proceed to locate the maximum log_sequence in the FND_LOG_MESSAGES table where the FND logging will be written.
select max(log_sequence)
from
fnd_log_messages fnd, fnd_user fu
where fnd.user_id = fu.user_id
and fu.user_name = '&USER_NAME'
order by log_sequence desc;
Pass in the USER_NAME which is being used - and is about to replicate the problem.
Take note of the sequence number that is returned.
Example: 81088151
5. Proceed now to submit the concurrent request.
Once it has completed, execute the sql from step 4 again - to locate the new maximum log_sequence.
select max(log_sequence)
from
fnd_log_messages fnd, fnd_user fu
where fnd.user_id = fu.user_id
and fu.user_name = '&USER_NAME'
order by log_sequence desc;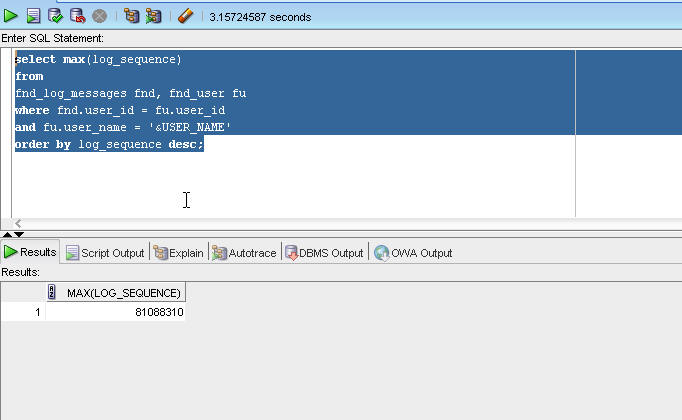
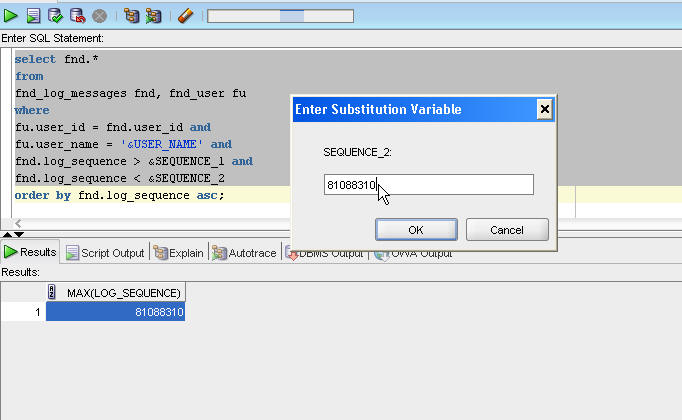
Example: 81088310
6. Pull all data related from the FND_LOG_MESSAGES table - by passing in the two sequence values along with the USER_NAME which submitted the concurrent request.
Execute the following sql statement:
select fnd.*
from
fnd_log_messages fnd, fnd_user fu
where
fu.user_id = fnd.user_id and
fu.user_name = '&USER_NAME' and
fnd.log_sequence > &SEQUENCE_1 and
fnd.log_sequence < &SEQUENCE_2
order by fnd.log_sequence asc;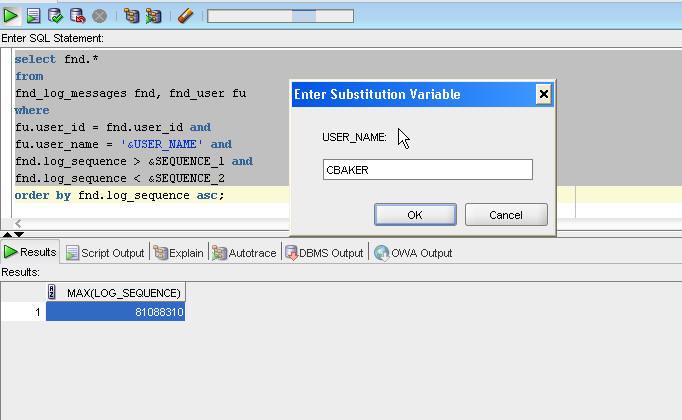
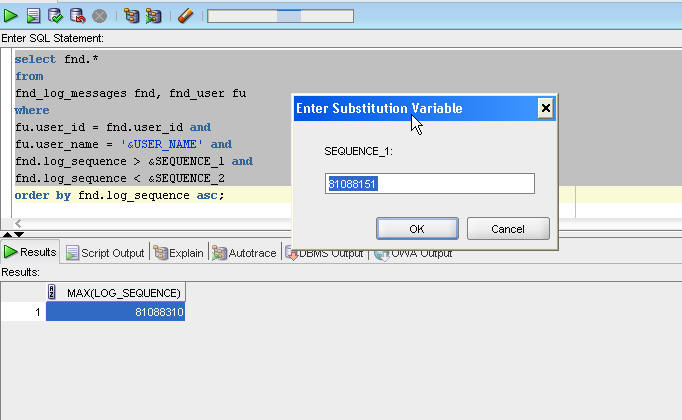
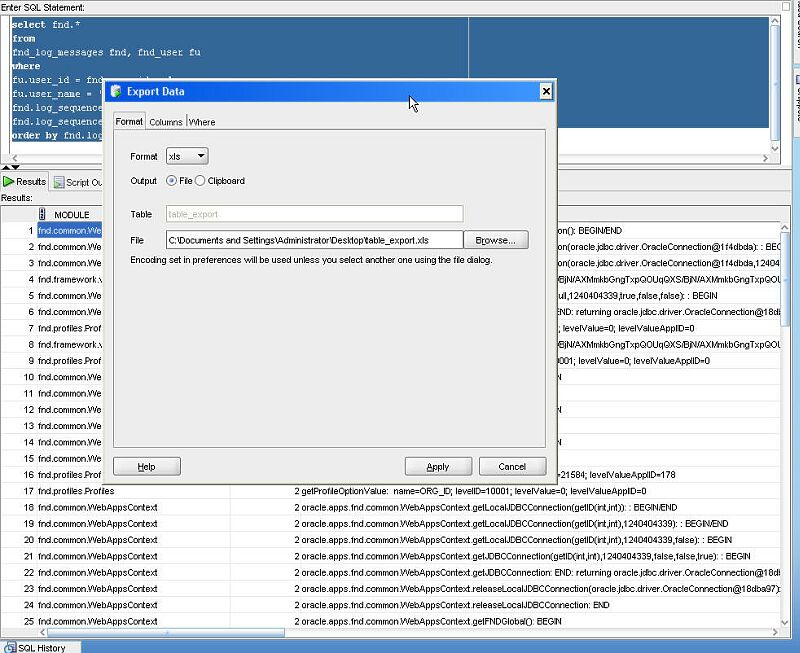
7. Export the data to an Excel Spreadsheet, using the export functionality within SQL Developer.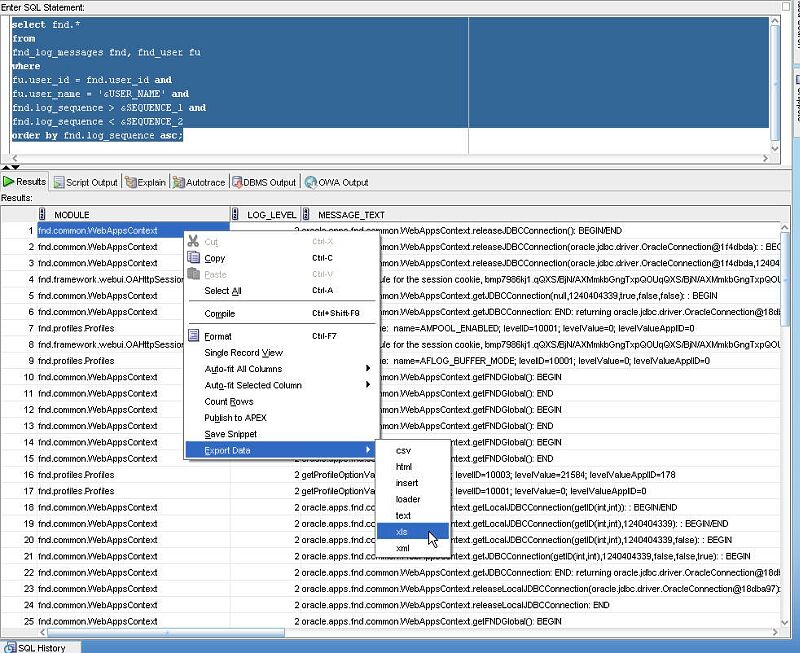
8. To locate the trace file, utilize the following sql to confirm the trace file location on the database server.
select name, value
from v$parameter
where name like 'user_dump_dest';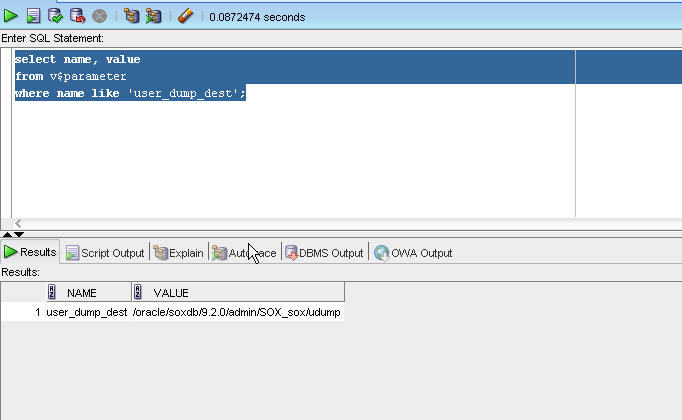
Move to the directory given on the database server, and list the trace files based on the Concurrent Request ID which was submitted.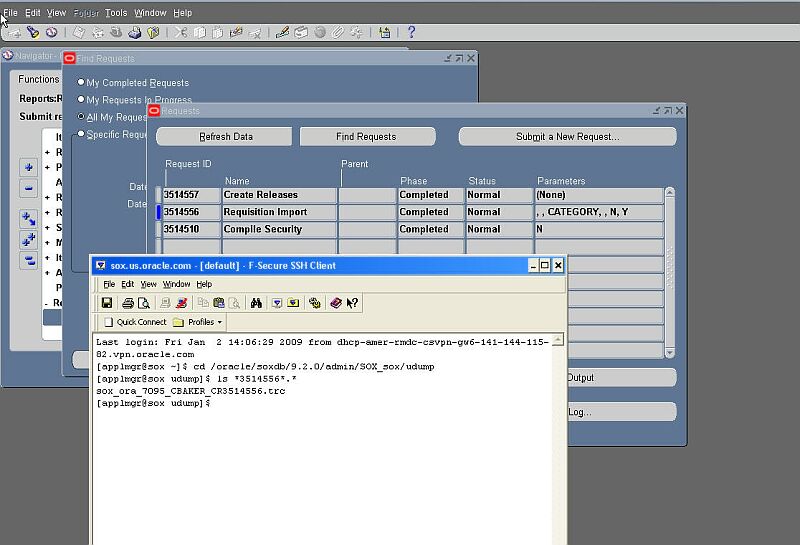
The trace filename will contain the USER_NAME which submitted the concurrent request along with the letters CR - as can be seen above.
Upload both the raw and tkprof trace files.
- tkprof <filename>.trc <filename>.out explain=<found username/password>
example: tkprof sox_ora_7095_CBAKER_CR3514556.trc 7095.out explain=<apps/apps>
PERFORMANCE ISSUES:
If the issue is for a performance problem, please use the following tkprof syntax so that the highest cost statement is seen first in the tkprof output -
- tkprof <filename>.trc <filename>.out explain=apps/apps sys=no sort='prsela, exeela, fchela'
- example: tkprof sox_ora_7095_CBAKER_CR3514556.trc 7095.out explain=<apps/apps> sys=no sort='prsela, exeela, fchela'
How can the SQL trace and FND Diagnostics be enabled when run a concurrent program?
最新推荐文章于 2024-11-04 11:27:49 发布


 121
121

 被折叠的 条评论
为什么被折叠?


