


Obtaining Xen Configuration and System Information
Perhaps the most basic step in monitoring a Xen system or isolating a problem is to get a high level overview of the Xen environment and underlying configuration. This information will be of particular importance when requesting help from a vendor or forum. A good way to obtain this information is to use the xm info command. For example, the following example shows output from xl info on a Red Hat Enterprise Linux 5 (RHEL5) system:
xl info
host                   : localhost.localdomain
release                : 2.6.18-53.el5xen
version                : #1 SMP Wed Oct 10 17:06:12 EDT 2007
machine                : i686
nr_cpus                : 1
nr_nodes               : 1
sockets_per_node       : 1
cores_per_socket       : 1
threads_per_core       : 1
cpu_mhz                : 2993
hw_caps                : 0febfbff:20100000:00000000:00000180:0000a015:00000000:00000001
total_memory           : 255
free_memory            : 14
xen_major              : 3
xen_minor              : 1
xen_extra              : .0-53.el5
xen_caps               : xen-3.0-x86_32p
xen_pagesize           : 4096
platform_params        : virt_start=0xf5800000
xen_changeset          : unavailable
cc_compiler            : gcc version 4.1.2 20070626 (Red Hat 4.1.2-14)
cc_compile_by          : brewbuilder
cc_compile_domain      : build.redhat.com
cc_compile_date        : Wed Oct 10 16:30:55 EDT 2007
xend_config_format     : 2
Monitoring Xen Performance with XenMon
The XenMon tool is useful for monitoring the performance Xen domains, particularly when identifying which domains are responsible for the highest I/O or processing loads on a system.
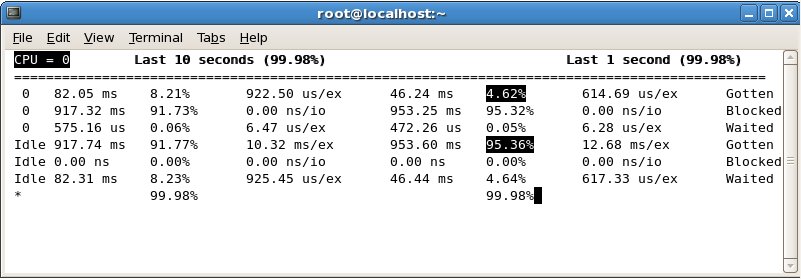
XenMon is started from the command-line using the xenmon.py command. The following figure shows a typical XenMon session:
The XenMon display shows two sets of data. On the left hand side are statistics captured over the preceding 10 seconds and on the right is the data for the last 1 second.
For each domain three sets of data are provided. The first row (the grammatically dubious Gotten) for each domain is the amount of time the domain as spent executing. The Blocked row shows statistics for idle time. Finally, the Waited row indicates the amount of time the domain has been in a wait state. For each category the amount of time spent in the particular mode and the time as a percentage of overall time during the corresponding period (i.e 1 or 10 seconds) is displayed. The final value depends on the category. For Gotten this represents processor time, for Blocked the average blocked time and for Wait the average waiting time.
By default XenMon displays information for CPU 0. If the system has more than one physical CPU then the p and n keys can be used to page through the data for each CPU on the system.
When XenMon is exited (using the q key) a summary of data collected during the monitoring session is displayed:
ms_per_sample = 100
Initialized with 1 cpu
CPU Frequency = 2993.98
Event counts:
00000000        Other
00000000        Add Domain
00000000        Remove Domain
00000000        Sleep
00022838        Wake
00022838        Block
00045666        Switch
00000000        Timer Func
00045666        Switch Prev
00045666        Switch Next
00000000        Page Map
00000000        Page Unmap
00000000        Page Transfer
processed 182674 total records in 288 seconds (634 per second)
woke up 288 times in 288 seconds (1 per second)
XenMon accepts a range of command-line options which control various aspects of the monitoring. For a breakdown of these options simply pass the --help argument through to xenmon.py:
xenmon.py --help
usage: xenmon.py [options]

options:
  -h, --help            show this help message and exit
  -l, --live            show the ncurses live monitoring frontend (default)
  -n, --notlive         write to file instead of live monitoring
  -p PREFIX, --prefix=PREFIX
                        prefix to use for output files
  -t DURATION, --time=DURATION
                        stop logging to file after this much time has elapsed
                        (in seconds). set to 0 to keep logging indefinitely
  -i INTERVAL, --interval=INTERVAL
                        interval for logging (in ms)
  --ms_per_sample=MSPERSAMPLE
                        determines how many ms worth of data goes in a sample
  --cpu=CPU             specifies which cpu to display data for
  --allocated           Display allocated time for each domain
  --noallocated         Don't display allocated time for each domain
  --blocked             Display blocked time for each domain
  --noblocked           Don't display blocked time for each domain
  --waited              Display waiting time for each domain
  --nowaited            Don't display waiting time for each domain
  --excount             Display execution count for each domain
  --noexcount           Don't display execution count for each domain
  --iocount             Display I/O count for each domain
  --noiocount           Don't display I/O count for each domain
参考自: http://www.virtuatopia.com/index.php/Xen_Monitoring_Tools_and_Techniques


 6985
6985

 被折叠的 条评论
为什么被折叠?
被折叠的 条评论
为什么被折叠?
 到【灌水乐园】发言


