


vue2 结合iview和百度地图API实现电子围栏
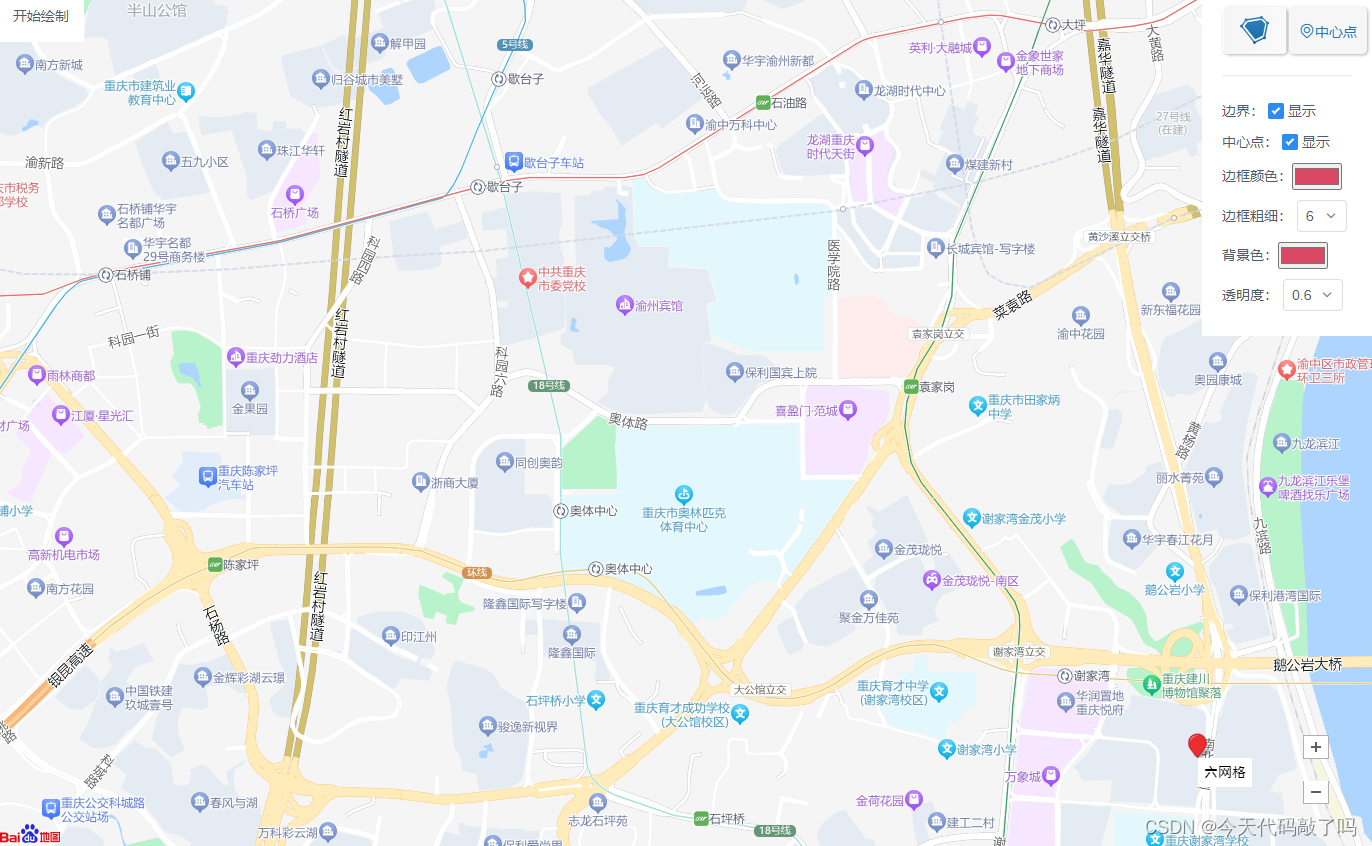
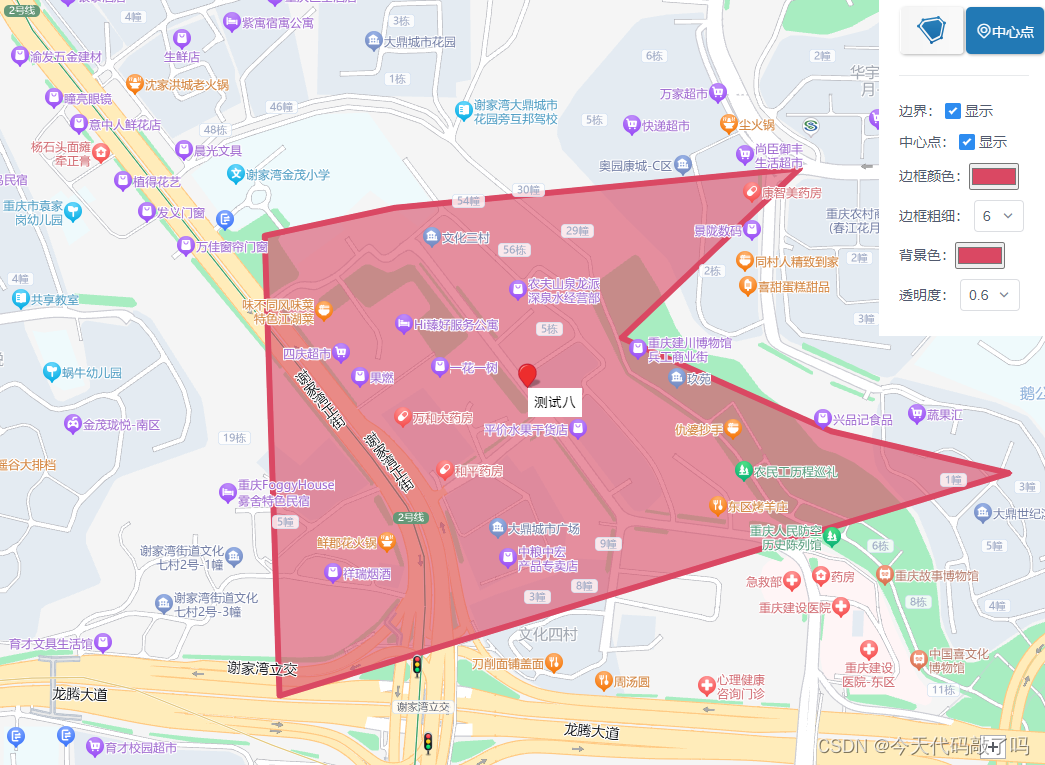
实现在地图上绘制电子围栏并自定义电子围栏样式,还可以标记中心点
1.百度地图API相关JS引用
 <script src="//api.map.baidu.com/api?type=webgl&v=1.0&ak=百度地图官网申请的ak"></script>
 //电子围栏相关的api
 <link href="//mapopen.cdn.bcebos.com/github/BMapGLLib/DrawingManager/src/DrawingManager.min.css" rel="stylesheet">
<script type="text/javascript"
  src="//mapopen.cdn.bcebos.com/github/BMapGLLib/DrawingManager/src/DrawingManager.min.js"></script>
2.页面代码
<template>
  <div style="position: relative;height:100%">
      <!--地图-->
     <div id="map" class="map" style="height:100%" />
     <div class="draw-btn" @click="drawMap()">开始绘制</div>
      <!--工具栏-->
    <div class="color-list" v-if="showDraw">
         <Button :type="isCenter?'info':'primary'"
                    size="small"
                    style="margin-right: 10px;"
                    @click="setCenter">
                 中心点
         </Button>
            <input type="color"
                   id="strokeColor"
                   v-model="strokeColor">
            <Select v-model="strokeWeight"
                    style="width:50px;margin:0 5px">
              <Option v-for="item in 9"
                      :value="item"
                      :key="item">{{ item }}</Option>
            </Select>
            <input type="color"
                   id="fillColor"
                   v-model="fillColor">
            <Select v-model="fillOpacity"
                    style="width:60px;margin:0 5px">
              <Option v-for="item in fillOpacityList"
                      :value="item"
                      :key="item">{{ item }}</Option>
            </Select>
          </div>
  </div>
</template>
<script>
export default {
  name: 'map',
   data() {
    return {
     strokeColor: '#DA4863',
      strokeWeight: 6,
      fillColor: '#DA4863',
      fillOpacity: 0.6,
      fillOpacityList: [0, 0.1, 0.2, 0.3, 0.4, 0.5, 0.6, 0.7, 0.8, 0.9, 1],
      polyLinePoints: [],
      markerPoints: [],
      polyLines: null,
      isCenter: false,
      showDraw:false
     }
    },
    computed:{
      changeData() {
      const { strokeColor, strokeWeight, fillColor, fillOpacity } = this
      return {
        strokeColor,
        strokeWeight,
        fillColor,
        fillOpacity
      }
    }
  },
  watch: {
    changeData: function (newV) {
      this.initSetMap()
    }
  },
  methods:{
  //开始绘制
  drawMap(){
    this.showDraw= true
    this.isCenter = false
    this.strokeColor = '#DA4863'
    this.strokeWeight = 6
    this.fillColor = '#DA4863'
    this.fillOpacity = 0.6
    this.initSetMap()
  },
   //获取坐标初始化地图
   init() {

       let data={blat: 29.516071,blng: 106.525681}
       this.initMap(data.blng, data.blat)
    },
    //清除坐标点
    clearMarkerOverlay() {
      const allOverlays = this.map.getOverlays()
      for (let i = 0; i < allOverlays.length; i++) {
        if (allOverlays[i].id && allOverlays[i].id === this.selectData.id) {
          this.map.removeOverlay(allOverlays[i])
        }
      }
    },
    //修改围栏样式时触发
    initSetMap() {
        this.polyLinePoints = []
       this.markerPoints = []
      var that = this
      const { strokeColor, strokeWeight, fillColor, fillOpacity } = this
      var overlaycomplete = function (e) {
        var mlnglat = []
        var path = e.overlay.getPath() // Array<Point> 返回多边型的点数组
        for (var i = 0; i < path.length; i++) {
          mlnglat.push({
            lng: path[i].lng,
            lat: path[i].lat
          })
        }
      console.log(mlnglat)
      }
      var styleOptions = {
        strokeColor: this.strokeColor, // 边线颜色。
        fillColor: this.fillColor, // 填充颜色。当参数为空时,圆形将没有填充效果。
        strokeWeight: this.strokeWeight, // 边线的宽度,以像素为单位。
        strokeOpacity: 1, // 边线透明度,取值范围0 - 1。
        fillOpacity: this.fillOpacity, // 填充的透明度,取值范围0 - 1。
        strokeStyle: 'solid' // 边线的样式,solid或dashed。
      }
      this.drawingManager = new BMapGLLib.DrawingManager(this.map, {
        isOpen: false, // 是否开启绘制模式
        enableDrawingTool: true, // 是否显示工具栏
        drawingToolOptions: {
          anchor: BMAP_ANCHOR_TOP_RIGHT, // 位置
          offset: new BMapGL.Size(5, 5) // 偏离值
        },
        polygonOptions: styleOptions // 多边形的样式
      })

      this.drawingManager.addEventListener('overlaycomplete', overlaycomplete)
    },
    //初始化地图
     initMap(lng, lat) {
      let that = this
      if (this.map) {
        this.map.clearOverlays()
      }
      this.map = new BMapGL.Map('map')
      var poi = new BMapGL.Point(lng, lat)
      this.map.centerAndZoom(poi, 18) // 设置中心点坐标和地图级别
      this.map.enableScrollWheelZoom() // 启用鼠标滚动对地图放大缩小
      this.map.addControl(new BMapGL.NavigationControl())

      if (this.polyLinePoints && this.polyLinePoints.length) {
        this.polyLinePoints.forEach((item) => {
          if (item.points && item.points.length) {
            let data = []
            item.points.forEach((col) => {
              var po = new BMapGL.Point(col.lng, col.lat)
              data.push(po)
            })
            this.polyLines = new BMapGL.Polygon(data, {
              strokeColor: item.strokeColor, // 边线颜色。
              fillColor: item.fillColor, // 填充颜色。当参数为空时,圆形将没有填充效果。
              strokeWeight: item.strokeWeight, // 边线的宽度,以像素为单位。
              strokeOpacity: 1, // 边线透明度,取值范围0 - 1。
              fillOpacity: item.fillOpacity // 填充的透明度,取值范围0 - 1。
            })
            this.map.addOverlay(this.polyLines)
          }
        })
      }
      if (this.markerPoints && this.markerPoints.length) {
        this.markerPoints.forEach((item) => {
          if (item.points && item.points.length) {
            let data = []
            item.points.forEach((col) => {
              var marker = new BMapGL.Marker(new BMapGL.Point(col.lng, col.lat))
              marker.id = item.id
              this.map.addOverlay(marker)
              const label = new BMapGL.Label('', {
                offset: new BMapGL.Size(0, 0)
              })
              label.setStyle({
                textAlign: 'center',
                // 设置label的样式
                color: 'white',
                fontSize: '14px',
                border: 'none',
                color: 'black',
                fontFamily: '黑体'
                // opacity: '0.5',
              })
              label.setContent(
                `<div style="background: rgba(255,255,255,1);border-radius: 12px;padding:3px 5px">${item.name}</div>`
              )
              marker.setLabel(label)
            })
          }
        })
      }
      //地图展示样式
      this.map.setMapStyleV2({
        styleJson: [
          // {
          //   featureType: 'poilabel',
          //   elementType: 'all',
          //   stylers: {
          //     visibility: 'off'
          //   }
          // },
          // {
          //   featureType: 'manmade',
          //   elementType: 'all',
          //   stylers: {
          //     visibility: 'off'
          //   }
          // },
          {
            featureType: 'building',
            elementType: 'all',
            stylers: {
              visibility: 'off'
            }
          }
        ]
      })
      this.map.addEventListener('click', function (e) {
      //点击地图设置中心点
        if (that.isCenter) {
          that.clearMarkerOverlay()
          var marker = new BMapGL.Marker(
            new BMapGL.Point(e.latlng.lng, e.latlng.lat)
          )
          marker.id = that.selectData.id
          that.map.addOverlay(marker)
          const label = new BMapGL.Label('', {
            offset: new BMapGL.Size(0, 0)
          })
          label.setStyle({
            textAlign: 'center',
            // 设置label的样式
            color: 'white',
            fontSize: '14px',
            border: 'none',
            color: 'black',
            fontFamily: '黑体'
            // opacity: '0.5',
          })
          label.setContent(
            `<div style="background: rgba(255,255,255,1);border-radius: 12px;padding:3px 5px">${that.selectData.name}</div>`
          )
          marker.setLabel(label)
        }
      })
    },
    setCenter() {
      this.isCenter = true
    },
  },
   mounted() {
   this.init()
   }
 }
</script>
<style scoped lang="less">
/deep/.BMapGLLib_Drawing {
  position: inherit !important;
}
/deep/ .BMapGLLib_Drawing .BMapGLLib_polyline {
  display: none !important;
}

/deep/ .BMapGLLib_Drawing_panel {
  position: absolute;
  right: 380px;
  top: 1%;
}
//隐藏除了多边形之外的按钮
/deep/ .BMapGLLib_Drawing .BMapGLLib_marker {
  display: none !important;
}
/deep/ .BMapGLLib_Drawing .BMapGLLib_circle {
  display: none !important;
}
/deep/ .BMapGLLib_Drawing .BMapGLLib_rectangle {
  display: none !important;
}
/deep/.BMap_stdMpZoom {
  width: 0 !important;
  height: 0 !important;
}
.draw-btn{
 position: absolute;
  left: 10px;
  top: 2%;
  z-index: 999;
}
.color-list {
  position: absolute;
  right: 10px;
  top: 2%;
  z-index: 999;
  margin: auto;
  display: flex;
  align-items: center;
  justify-content: center;
}
</style>
效果图


 1万+
1万+


 被折叠的 条评论
为什么被折叠?
被折叠的 条评论
为什么被折叠?
 到【灌水乐园】发言


