


1、Spark MLlib Statistics统计
Spark Mllib统计模块代码结构如下:

1.1列统计汇总
计算每列最大值、最小值、平均值、方差值、L1范数、L2范数。
//读取数据,转换成RDD[Vector]类型
valdata_path ="/home/jb-huangmeiling/sample_stat.txt"
valdata =sc.textFile(data_path).map(_.split("\t")).map(f => f.map(f => f.toDouble))
valdata1 =data.map(f => Vectors.dense(f))
//计算每列最大值、最小值、平均值、方差值、L1范数、L2范数
valstat1 = Statistics.colStats(data1)
stat1.max
stat1.min
stat1.mean
stat1.variance
stat1.normL1
stat1.normL2
执行结果:
数据
| 1 | 2 | 3 | 4 | 5 |
| 6 | 7 | 1 | 5 | 9 |
| 3 | 5 | 6 | 3 | 1 |
| 3 | 1 | 1 | 5 | 6 |
Scala> data1.collect
res19: Array[org.apache.spark.mllib.linalg.Vector] = Array([1.0,2.0,3.0,4.0,5.0], [6.0,7.0,1.0,5.0,9.0], [3.0,5.0,6.0,3.0,1.0], [3.0,1.0,1.0,5.0,6.0])
scala> stat1.max
res20: org.apache.spark.mllib.linalg.Vector = [6.0,7.0,6.0,5.0,9.0]
scala> stat1.min
res21: org.apache.spark.mllib.linalg.Vector = [1.0,1.0,1.0,3.0,1.0]
scala> stat1.mean
res22: org.apache.spark.mllib.linalg.Vector = [3.25,3.75,2.75,4.25,5.25]
scala> stat1.variance
res23: org.apache.spark.mllib.linalg.Vector = [4.25,7.583333333333333,5.583333333333333,0.9166666666666666,10.916666666666666]
scala> stat1.normL1
res24: org.apache.spark.mllib.linalg.Vector = [13.0,15.0,11.0,17.0,21.0]
scala> stat1.normL2
res25: org.apache.spark.mllib.linalg.Vector = [7.416198487095663,8.888194417315589,6.855654600401044,8.660254037844387,11.958260743101398]
1.2相关系数
Pearson相关系数表达的是两个数值变量的线性相关性,它一般适用于正态分布。其取值范围是[-1, 1], 当取值为0表示不相关,取值为(0~-1]表示负相关,取值为(0, 1]表示正相关。
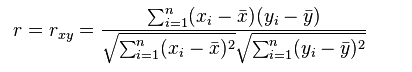
Spearman相关系数也用来表达两个变量的相关性,但是它没有Pearson相关系数对变量的分布要求那么严格,另外Spearman相关系数可以更好地用于测度变量的排序关系。其计算公式为:
//计算pearson系数、spearman相关系数
valcorr1 = Statistics.corr(data1,"pearson")
valcorr2 = Statistics.corr(data1,"spearman")
valx1 =sc.parallelize(Array(1.0,2.0,3.0,4.0))
valy1 =sc.parallelize(Array(5.0,6.0,6.0,6.0))
valcorr3 = Statistics.corr(x1,y1,"pearson")
scala> corr1
res6: org.apache.spark.mllib.linalg.Matrix =
1.0 0.7779829610026362 -0.39346431156047523 ... (5 total)
0.7779829610026362 1.0 0.14087521363240252 ...
-0.39346431156047523 0.14087521363240252 1.0 ...
0.4644203640128242 -0.09482093118615205 -0.9945577827230707 ...
0.5750122832421579 0.19233705001984078 -0.9286374704669208 ...
scala> corr2
res7: org.apache.spark.mllib.linalg.Matrix =
1.0 0.632455532033675 -0.5000000000000001 ... (5 total)
0.632455532033675 1.0 0.10540925533894883 ...
-0.5000000000000001 0.10540925533894883 1.0 ...
0.5000000000000001 -0.10540925533894883 -1.0000000000000002 ...
0.6324555320336723 0.20000000000000429 -0.9486832980505085 ...
scala> corr3
res8: Double = 0.7745966692414775
1.3假设检验
MLlib当前支持用于判断拟合度或者独立性的Pearson卡方(chi-squared ( χ2) )检验。不同的输入类型决定了是做拟合度检验还是独立性检验。拟合度检验要求输入为Vector, 独立性检验要求输入是Matrix。
//卡方检验
valv1 = Vectors.dense(43.0,9.0)
valv2 = Vectors.dense(44.0,4.0)
valc1 = Statistics.chiSqTest(v1,v2)
执行结果:
c1: org.apache.spark.mllib.stat.test.ChiSqTestResult =
Chi squared test summary:
method: pearson
degrees of freedom = 1
statistic = 5.482517482517483
pValue = 0.01920757707591003
Strong presumption against null hypothesis: observed follows the same distribution as expected..
结果返回:统计量:pearson、自由度:1、值:5.48、概率:0.019。
-
顶
- 2
-
踩
- 0


 2195
2195

 被折叠的 条评论
为什么被折叠?
被折叠的 条评论
为什么被折叠?
 到【灌水乐园】发言


