


<asp:Chart ID="ChartBar" runat="server" Width="800px" BackColor="#FFFFCC" Palette="BrightPastel" BorderWidth = "2" BorderColor = "#cc9900" >
<Legends>
<asp:Legend IsTextAutoFit="False" Name="Default" BackColor="Transparent" Font="Trebuchet MS, 8.25pt, style=Bold">
</asp:Legend>
</Legends>
<ChartAreas>
<asp:ChartArea Name="ChartArea1">
</asp:ChartArea>
</ChartAreas>
</asp:Chart>
<asp:Chart ID="ChartPie" runat="server" Width="400px" BackColor="#FFFFCC" Palette="BrightPastel" BorderWidth = "0" BorderColor = "#cc9900" >
<Legends>
<asp:Legend IsTextAutoFit="False" Name="Default" BackColor="Transparent" Font="Trebuchet MS, 8.25pt, style=Bold">
</asp:Legend>
</Legends>
<ChartAreas>
<asp:ChartArea Name="ChartArea1">
</asp:ChartArea>
</ChartAreas>
</asp:Chart>
C#部分:
//获取每月销售情况
int[] arraySell=new int[]{10};
//获取月份
string[] arrayMonths = new string[] { "1月", "2月", "3月", "4月", "5月", "6月", "7月", "8月", "9月", "10月", "11月", "12月" };
//获取部门
string[] arrayDeparts = new string[] { "部门1", "部门2", "部门3" };
Series seriess = new Series("销售情况");
seriess.BorderWidth = 3;
seriess.ShadowOffset = 2;
Series seriesPies = new Series("销售情况");
seriesPies.ChartType = SeriesChartType.Pie;
seriesPies.BorderWidth = 3;
seriesPies.ShadowOffset = 2;
this.ChartBar.Series.Add(seriess);
this.ChartPie.Series.Add(seriesPies);
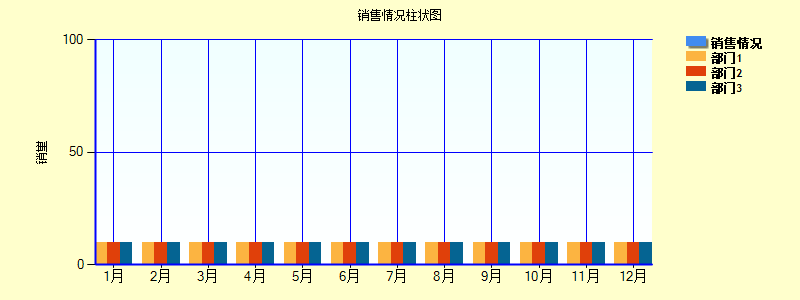
Title tBar = new Title("销售情况柱状图");
this.ChartBar.Titles.Add(tBar);
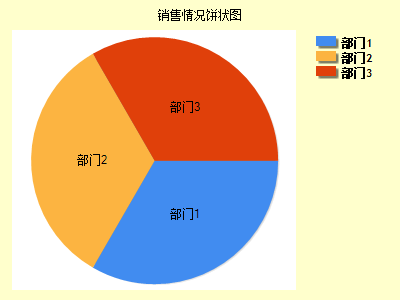
Title tPie = new Title("销售情况饼状图");
this.ChartPie.Titles.Add(tPie);
this.ChartBar.ChartAreas["ChartArea1"].AxisX.Interval = 1;//x轴数据显示间隔
this.ChartBar.ChartAreas["ChartArea1"].AxisY.Interval = 50;
//画柱状图
foreach (string d in arrayDeparts)
{
Series tempseries = new Series(string.Format("{0}", d));
this.ChartBar.Series.Add(tempseries);
foreach (string m in arrayMonths)
{
foreach (int n in arraySell)
{
tempseries.Points.AddXY(m, n);
}
}
}
//画饼图
foreach (string d in arrayDeparts)
{
foreach(int n in arraySell)
{
seriesPies.Points.AddXY(d, n);
}
}
this.ChartBar.ChartAreas["ChartArea1"].AxisX.IsMarginVisible = false;
this.ChartBar.ChartAreas["ChartArea1"].Area3DStyle.Enable3D = false;
//背景色设置
this.ChartBar.ChartAreas["ChartArea1"].ShadowColor = Color.Transparent;
this.ChartBar.ChartAreas["ChartArea1"].BackColor = Color.Azure;
this.ChartBar.ChartAreas["ChartArea1"].BackGradientStyle = GradientStyle.TopBottom;
this.ChartBar.ChartAreas["ChartArea1"].BackSecondaryColor = Color.White;
//X,Y坐标线颜色和大小
this.ChartBar.ChartAreas["ChartArea1"].AxisX.LineColor = Color.Blue;
this.ChartBar.ChartAreas["ChartArea1"].AxisY.LineColor = Color.Blue;
this.ChartBar.ChartAreas["ChartArea1"].AxisX.LineWidth = 2;
this.ChartBar.ChartAreas["ChartArea1"].AxisY.LineWidth = 2;
this.ChartBar.ChartAreas["ChartArea1"].AxisY.Title = "销量";
//中间X,Y线条的颜色设置
this.ChartBar.ChartAreas["ChartArea1"].AxisX.MajorGrid.LineColor = Color.Blue;
this.ChartBar.ChartAreas["ChartArea1"].AxisY.MajorGrid.LineColor = Color.Blue;
//X.Y轴数据显示间隔
this.ChartBar.ChartAreas["ChartArea1"].AxisX.Interval = 1; //X轴数据显示间隔
this.ChartBar.ChartAreas["ChartArea1"].AxisY.Interval = 50;
//X轴线条显示间隔
this.ChartBar.ChartAreas["ChartArea1"].AxisX.MajorGrid.Interval = 1;
效果


 1万+
1万+

 被折叠的 条评论
为什么被折叠?
被折叠的 条评论
为什么被折叠?
 到【灌水乐园】发言


