


es官网下载安装包
上传并解压安装包
tar -zxvf /data/software/elk/filebeat-7.1.1-linux-x86_64.tar.gz
修改filebeat配置文件(以采集springboot日志为例,将错误的堆栈信息采集为一行)
vim /data/software/elk/filebeat-7.1.1-linux-x86_64/filebeat.yml
## 内容
###################### Filebeat Configuration Example #########################

# This file is an example configuration file highlighting only the most common
# options. The filebeat.reference.yml file from the same directory contains all the
# supported options with more comments. You can use it as a reference.
#
# You can find the full configuration reference here:
# https://www.elastic.co/guide/en/beats/filebeat/index.html

# For more available modules and options, please see the filebeat.reference.yml sample
# configuration file.

#=========================== Filebeat inputs =============================

filebeat.config.inputs:
  enable: true
  path: ${path.config}/filebeat.yml
  reload.enabled: true
  reload.period: 2s

filebeat.inputs:
  - type: log
    multiline.pattern: ^\d{4}-\d{2}-\d{2} \d{2}:\d{2}:\d{2}
    multiline.match: after
    multiline.negate: true
    enabled: true
    paths:
      - /data/project/portal/backend/backstage/logs/backstage-info.log
    fields:
      service: backstage
  - type: log
    multiline.pattern: ^\d{4}-\d{2}-\d{2} \d{2}:\d{2}:\d{2}
    multiline.match: after
    multiline.negate: true
    enabled: true
    paths:
      - /data/project/province/backstage/logs/province-energy-platform-info.log
    fields:
      service: province
  - type: log
    multiline.pattern: ^\d{4}-\d{2}-\d{2} \d{2}:\d{2}:\d{2}
    multiline.match: after
    multiline.negate: true
    enabled: true
    paths:
      - /data/project/discipline-inspection/backend/logs/discipline-inspection-backend-info.log
    fields:
      service: discipline-inspection
  - type: log
    multiline.pattern: ^\d{4}-\d{2}-\d{2} \d{2}:\d{2}:\d{2}
    multiline.match: after
    multiline.negate: true
    enabled: true
    paths:
      - /data/project/zhongyuan/backend/logs/zhongyuan-backend-info.log
    fields:
      service: zhongyuan
  - type: log
    multiline.pattern: ^\d{4}-\d{2}-\d{2} \d{2}:\d{2}:\d{2}
    multiline.match: after
    multiline.negate: true
    enabled: true
    paths:
      - /data/project/energy/backend/gateway/logs/gateway/*.log
    fields:
      service: gateway-energy
  - type: log
    multiline.pattern: ^\d{4}-\d{2}-\d{2} \d{2}:\d{2}:\d{2}
    multiline.match: after
    multiline.negate: true
    enabled: true
    paths:
      - /data/project/province/gateway/logs/gateway/*.log
    fields:
      service: gateway-province
    #- c:\programdata\elasticsearch\logs\*

  # Exclude lines. A list of regular expressions to match. It drops the lines that are
  # matching any regular expression from the list.
  #exclude_lines: ['^DBG']

  # Include lines. A list of regular expressions to match. It exports the lines that are
  # matching any regular expression from the list.
  #include_lines: ['^ERR', '^WARN']

  # Exclude files. A list of regular expressions to match. Filebeat drops the files that
  # are matching any regular expression from the list. By default, no files are dropped.
  #exclude_files: ['.gz$']

  # Optional additional fields. These fields can be freely picked
  # to add additional information to the crawled log files for filtering
  #fields:
  #  level: debug
  #  review: 1

  ### Multiline options

  # Multiline can be used for log messages spanning multiple lines. This is common
  # for Java Stack Traces or C-Line Continuation

  # The regexp Pattern that has to be matched. The example pattern matches all lines starting with [


  # Defines if the pattern set under pattern should be negated or not. Default is false.


  # Match can be set to "after" or "before". It is used to define if lines should be append to a pattern
  # that was (not) matched before or after or as long as a pattern is not matched based on negate.
  # Note: After is the equivalent to previous and before is the equivalent to to next in Logstash


#============================= Filebeat modules ===============================

#filebeat.config.modules:
  # Glob pattern for configuration loading
#  path: ${path.config}/filebeat.yml

  # Set to true to enable config reloading
#  reload.enabled: true

  # Period on which files under path should be checked for changes
#  reload.period: 10s

#==================== Elasticsearch template setting ==========================

setup.template.settings:
  index.number_of_shards: 1
  #index.codec: best_compression
  #_source.enabled: false

#================================ General =====================================

# The name of the shipper that publishes the network data. It can be used to group
# all the transactions sent by a single shipper in the web interface.
#name:

# The tags of the shipper are included in their own field with each
# transaction published.
#tags: ["service-X", "web-tier"]

# Optional fields that you can specify to add additional information to the
# output.
#fields:
#  env: staging


#============================== Dashboards =====================================
# These settings control loading the sample dashboards to the Kibana index. Loading
# the dashboards is disabled by default and can be enabled either by setting the
# options here or by using the `setup` command.
#setup.dashboards.enabled: false

# The URL from where to download the dashboards archive. By default this URL
# has a value which is computed based on the Beat name and version. For released
# versions, this URL points to the dashboard archive on the artifacts.elastic.co
# website.
#setup.dashboards.url:

#============================== Kibana =====================================

# Starting with Beats version 6.0.0, the dashboards are loaded via the Kibana API.
# This requires a Kibana endpoint configuration.
setup.kibana:

  # Kibana Host
  # Scheme and port can be left out and will be set to the default (http and 5601)
  # In case you specify and additional path, the scheme is required: http://localhost:5601/path
  # IPv6 addresses should always be defined as: https://[2001:db8::1]:5601
  #host: "localhost:5601"

  # Kibana Space ID
  # ID of the Kibana Space into which the dashboards should be loaded. By default,
  # the Default Space will be used.
  #space.id:

#============================= Elastic Cloud ==================================

# These settings simplify using filebeat with the Elastic Cloud (https://cloud.elastic.co/).

# The cloud.id setting overwrites the `output.elasticsearch.hosts` and
# `setup.kibana.host` options.
# You can find the `cloud.id` in the Elastic Cloud web UI.
#cloud.id:

# The cloud.auth setting overwrites the `output.elasticsearch.username` and
# `output.elasticsearch.password` settings. The format is `<user>:<pass>`.
#cloud.auth:

#================================ Outputs =====================================

# Configure what output to use when sending the data collected by the beat.

#-------------------------- Elasticsearch output ------------------------------
#output.elasticsearch:
  # Array of hosts to connect to.
 # hosts: ["localhost:9200"]

  # Optional protocol and basic auth credentials.
  #protocol: "https"
  #username: "elastic"
  #password: "changeme"

#----------------------------- Logstash output --------------------------------
output.logstash:
  hosts: ["192.168.1.71:5044"]

  # Optional SSL. By default is off.
  # List of root certificates for HTTPS server verifications
  #ssl.certificate_authorities: ["/etc/pki/root/ca.pem"]

  # Certificate for SSL client authentication
  #ssl.certificate: "/etc/pki/client/cert.pem"

  # Client Certificate Key
  #ssl.key: "/etc/pki/client/cert.key"

#================================ Processors =====================================

# Configure processors to enhance or manipulate events generated by the beat.

processors:
  - add_host_metadata: ~
  - add_cloud_metadata: ~

#================================ Logging =====================================

# Sets log level. The default log level is info.
# Available log levels are: error, warning, info, debug
#logging.level: debug

# At debug level, you can selectively enable logging only for some components.
# To enable all selectors use ["*"]. Examples of other selectors are "beat",
# "publish", "service".
#logging.selectors: ["*"]

#============================== Xpack Monitoring ===============================
# filebeat can export internal metrics to a central Elasticsearch monitoring
# cluster.  This requires xpack monitoring to be enabled in Elasticsearch.  The
# reporting is disabled by default.

# Set to true to enable the monitoring reporter.
#xpack.monitoring.enabled: false

# Uncomment to send the metrics to Elasticsearch. Most settings from the
# Elasticsearch output are accepted here as well. Any setting that is not set is
# automatically inherited from the Elasticsearch output configuration, so if you
# have the Elasticsearch output configured, you can simply uncomment the
# following line.
#xpack.monitoring.elasticsearch:

#================================= Migration ==================================

# This allows to enable 6.7 migration aliases
#migration.6_to_7.enabled: true
启动filebeat,disown命令可以让filebeat关闭ssh会话后,仍能够后台运行,重启的话,需要ps -ef | grep filebeat,然后kill pid
nohup ./filebeat -e -c filebeat.yml >filebeat.log 2>&1 & disown
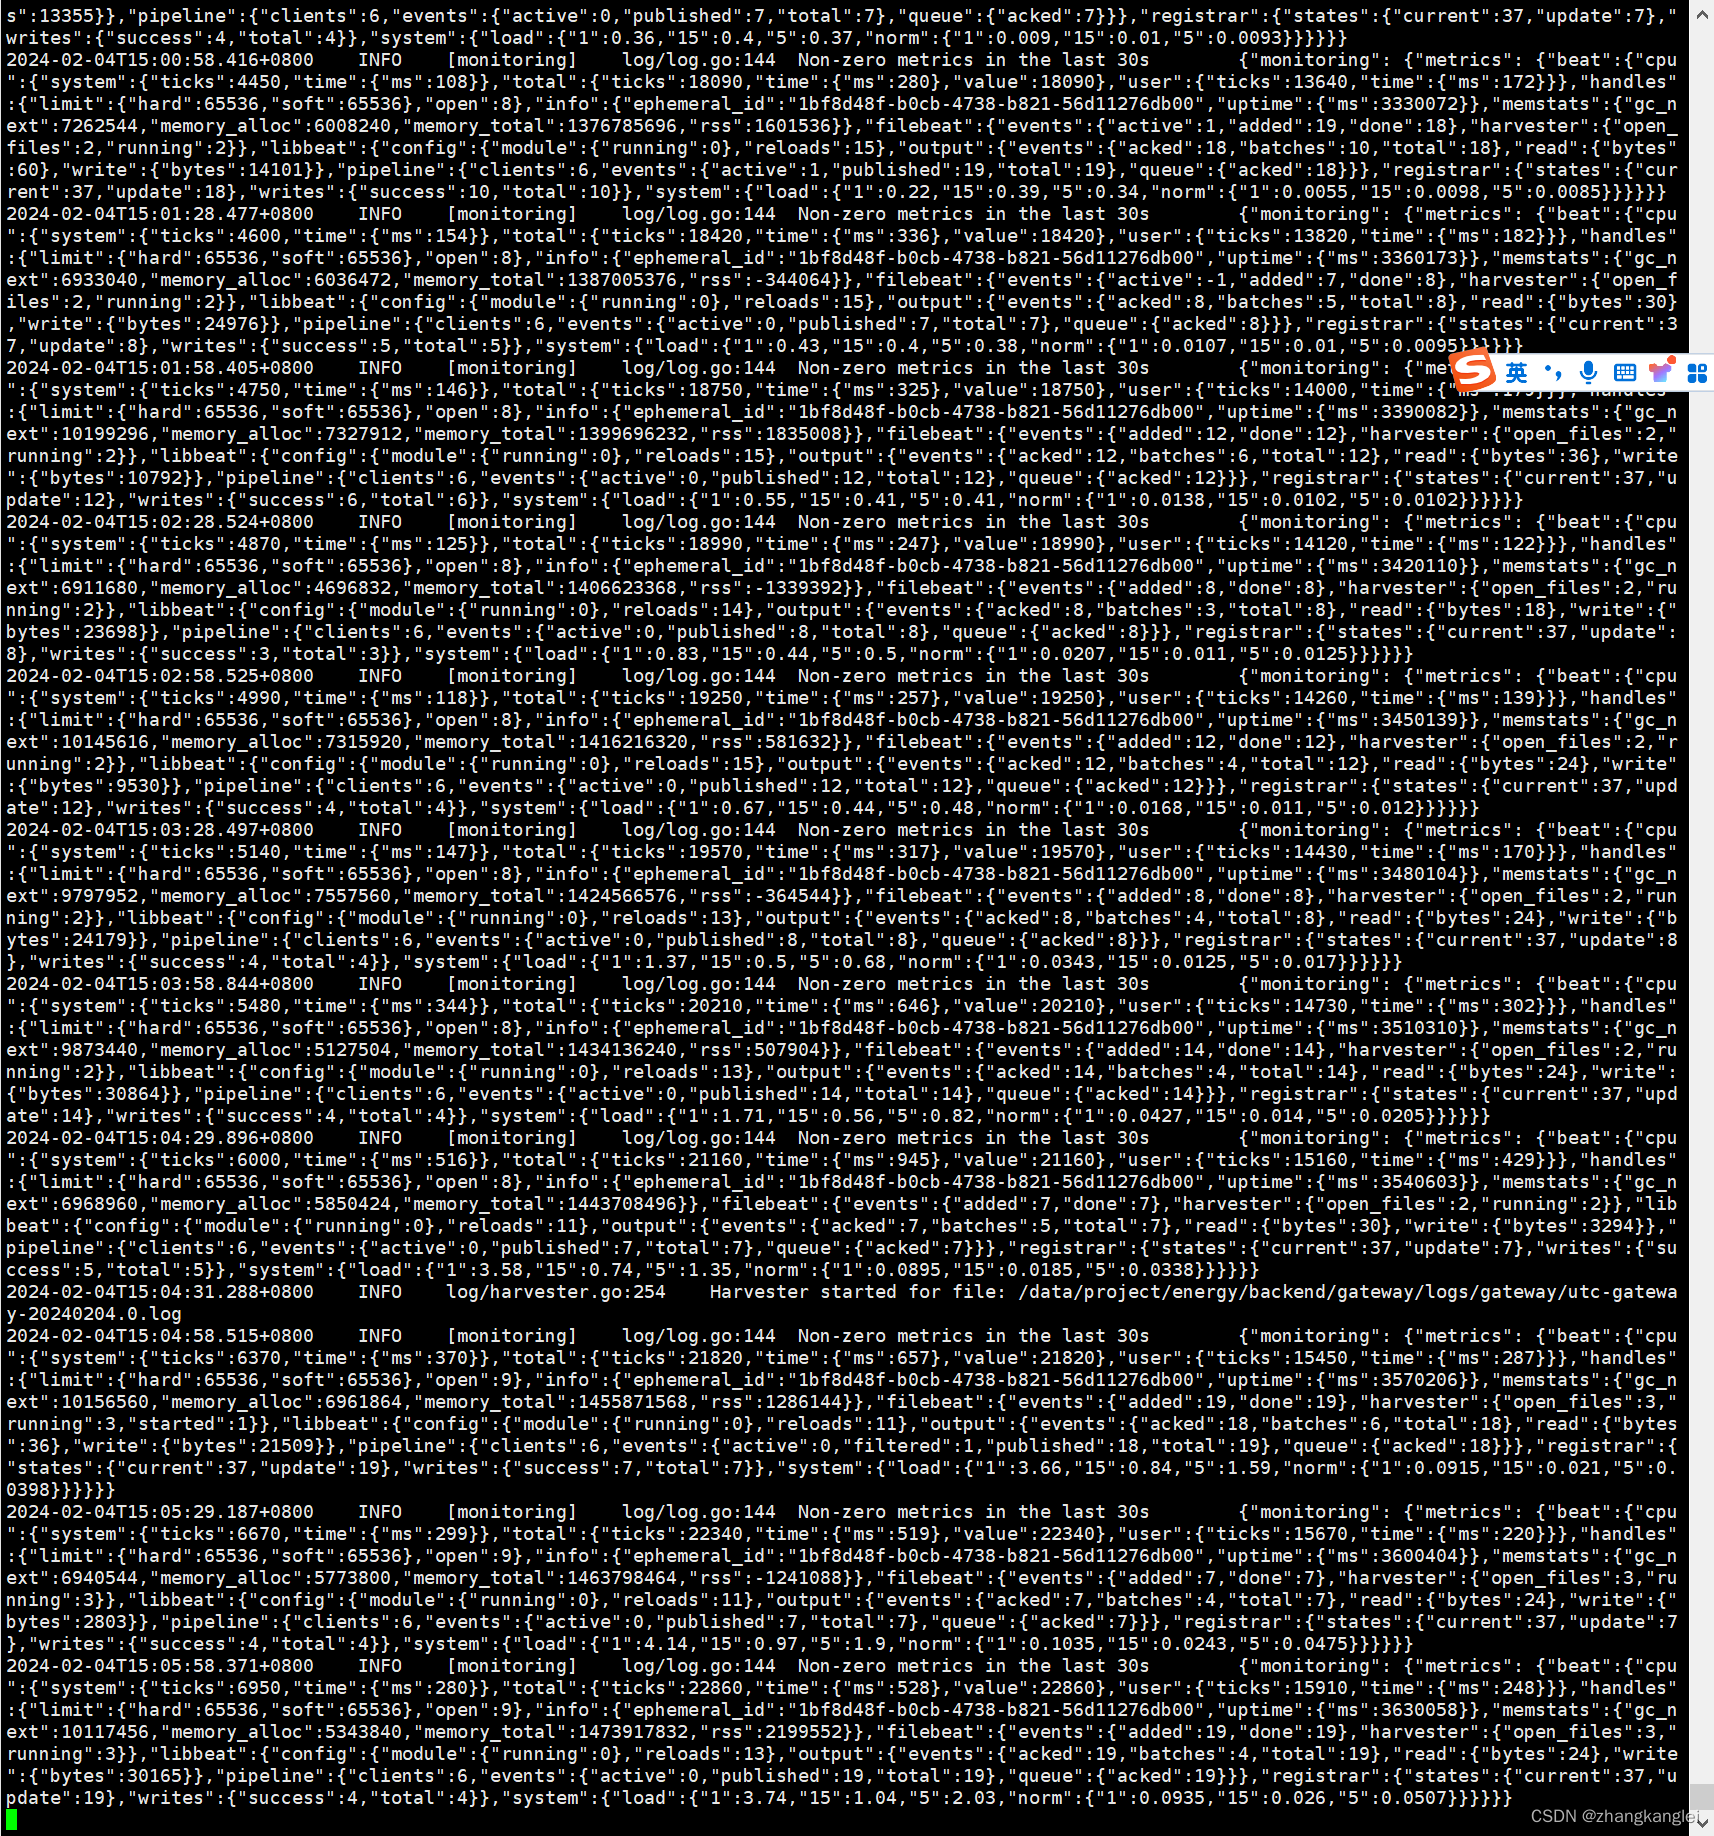
成功日志
tail -500f /data/software/elk/filebeat-7.1.1-linux-x86_64/filebeat.log


 4123
4123


 被折叠的 条评论
为什么被折叠?
被折叠的 条评论
为什么被折叠?
 到【灌水乐园】发言


