


Android统计图表MPAndroidChart
MPAndroidChart是在Android平台上开源的第三方统计图表库,可以绘制样式复杂、丰富的各种统计图表,如一般常见的折线图、饼状图、柱状图、散点图、金融股票中使用的的“蜡烛”图、“泡泡”统计图、雷达状统计饼状图等等。简言之,AndroidMPChart基本上可以满足日常在Android平台上的统计图表开发需要。
AndroidMPChart在github上的项目主页: https://github.com/PhilJay/MPAndroidChart
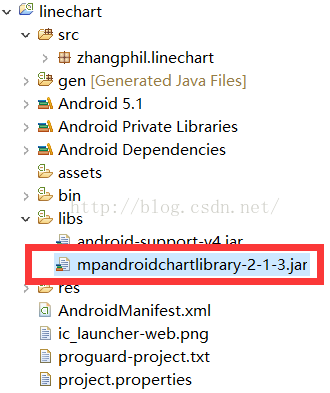
在自己的项目的libs中,导入其发布的jar包即可使用MPAndroidChart。MPAndroidChart发布的jar包页面在: https://github.com/PhilJay/MPAndroidChart/releases
AndroidMPChart使用方法:在上面的releases页面下载最新的jar包,复制到自己的项目libs中即可使用。如图:
主要的Api方法:
-
setDescription(String desc): 设置表格的描述 -
setDescriptionTypeface(Typeface t):自定义表格中显示的字体 -
setDrawYValues(boolean enabled): 设置是否显示y轴的值的数据 setValuePaintColor(int color):设置表格中y轴的值的颜色,但是必须设置setDrawYValues(true)-
setValueTypeface(Typeface t):设置字体 -
setValueFormatter(DecimalFormat format): 设置显示的格式 -
setPaint(Paint p, int which): 自定义笔刷
public ChartData getDataCurrent():返回ChartData对象当前显示的图表。它包含了所有信息的显示值最小和最大值等public float getYChartMin(): 返回当前最小值public float getYChartMax(): 返回当前最大值public float getAverage(): 返回所有值的平均值。public float getAverage(int type): 返回平均值public PointF getCenter(): 返回中间点public Paint getPaint(int which): 得到笔刷
setTouchEnabled(boolean enabled): 设置是否可以触摸,如为false,则不能拖动,缩放等setDragScaleEnabled(boolean enabled): 设置是否可以拖拽,缩放setOnChartValueSelectedListener(OnChartValueSelectedListener l): 设置表格上的点,被点击的时候,的回调函数setHighlightEnabled(boolean enabled): 设置点击value的时候,是否高亮显示public void highlightValues(Highlight[] highs): 设置高亮显示
saveToGallery(String title): 保存图表到图库中saveToPath(String title, String pathOnSD): 保存.setScaleMinima(float x, float y): 设置最小的缩放centerViewPort(int xIndex, float val): 设置视口fitScreen(): 适应屏幕
public class MainActivity extends Activity {

    private LineChart mLineChart;
    private XAxis xAxis;         //X坐标轴
    private YAxis yAxis;         //Y坐标轴

    @Override
    protected void onCreate(Bundle savedInstanceState) {
        super.onCreate(savedInstanceState);
        setContentView(R.layout.activity_main);

        mLineChart = (LineChart) findViewById(R.id.chart);

        xAxis = mLineChart.getXAxis();
        yAxis = mLineChart.getAxisLeft();

        LineData mLineData = getLineData();


        modifyingTheViewport();
        animations();
        markerView();
        miscellaneous();

        //showChart(mLineChart, mLineData);
    }

    private void miscellaneous() {
        mLineChart.getData();   //返回这个图表中的data类型的值,
        mLineChart.getViewPortHandler();    //返回这个图表中的各种状态,返回类型为ViewPortHandler
        mLineChart.getRenderer();   //返回绘制图表的数据,类型是DataRenderer

        PointF pointF = new PointF();
        pointF = mLineChart.getCenter();   //返回中心点,返回类型是PointF,即(x,y)

        mLineChart.getCenterOffsets();  //返回图表绘制区域的中心点
        mLineChart.getYMin();  //返回 数据Y的最小值 返回值是float类型
        mLineChart.getYMax();  //返回 数据Y的最大值 返回值是float类型

        System.out.println(mLineChart.getHighestVisibleXIndex());
        mLineChart.getLowestVisibleXIndex();  //返回 能见到的X的最小值下标 返回值是int类型
        mLineChart.getHighestVisibleXIndex();  //返回 能见到的X的最大值下标 返回值是int类型

        mLineChart.getChartBitmap();  //返回 最后状态的图表的Bitmap
        //。。。。。。
    }

    private void markerView() {

    }

    private void animations() {
        //动画效果在API版本11(Android 3.0.X)以上才能起作用,低版本不会执行,但不会崩溃
        //执行动画并不会刷新表格 即执行invalidate();方法

        mLineChart.animateX(1000); //从左到右绘制图形,参数是int类型的 持续时间
        mLineChart.animateY(3000); //从下到上绘制图形,参数是int类型的 持续时间
        mLineChart.animateXY(3000, 2000); //x,y同时绘制,参数是(int xDuration, int yDuration)

    }

    private void modifyingTheViewport() {
        mLineChart.setVisibleXRangeMaximum(5);  //一个界面显示多少个点,其他点可以通过滑动看到
        mLineChart.setVisibleXRangeMinimum(3);  //一个界面最少显示多少个点,放大后最多 放大到 剩多少 个点
//      mLineChart.setViewPortOffsets(0,0,0, 0);  //设置图表显示的偏移量,不建议使用,因为会影响图表的自动计算
        mLineChart.resetViewPortOffsets();  //重新设置图表显示的偏移量,自动计算,可取消上面的那个操作
//        mLineChart.setExtraOffsets(20, 30, 50, 10);  //设置图表外,布局内显示的偏移量

        mLineChart.fitScreen();  //重置图表的缩放,拖动并使图表符合它的界限
        mLineChart.moveViewToX(2);  //将左边的边放到指定的位置,参数是(float xindex)

        mLineChart.zoomIn();  //默认视图放大1.4倍,
        mLineChart.zoomOut();  //默认视图缩小到0.7倍,
        mLineChart.zoom(1.0f,1.0f,0f,0f);  //自定义缩放(float scaleX, float scaleY, float x, float y)X缩放倍数,Y缩放倍数,x坐标,y坐标。1f是原大小
    }

    private void showChart(LineChart lineChart, LineData lineData) {

        //General Chart Styling 通用的图表造型,还有些对于特定图表有这特定方法的造型。
        //请参考https://github.com/PhilJay/MPAndroidChart/wiki/Specific-chart-settings
        lineChart.setBackgroundColor(Color.argb(0, 173, 215, 210));// 设置图表背景 参数是个Color对象

        lineChart.setDescription("setDescription我在这儿"); //图表默认右下方的描述,参数是String对象
        lineChart.setDescriptionColor(Color.rgb(227, 135, 0));  //上面字的颜色,参数是Color对象
//      lineChart.setDescriptionPosition(400f,600f);    //上面字的位置,参数是float类型,像素,从图表左上角开始计算
//      lineChart.setDescriptionTypeface();     //上面字的字体,参数是Typeface 对象
        lineChart.setDescriptionTextSize(16);    //上面字的大小,float类型[6,16]

        lineChart.setNoDataTextDescription("没有数据呢(⊙o⊙)");   //没有数据时显示在中央的字符串,参数是String对象

        lineChart.setDrawGridBackground(false);//设置图表内格子背景是否显示,默认是false
        lineChart.setGridBackgroundColor(Color.rgb(255, 0, 0));//设置格子背景色,参数是Color类型对象

        lineChart.setDrawBorders(true);     //设置图表内格子外的边框是否显示
        lineChart.setBorderColor(Color.rgb(236, 228, 126));   //上面的边框颜色
        lineChart.setBorderWidth(20);       //上面边框的宽度,float类型,dp单位
//      lineChart.setMaxVisibleValueCount();设置图表能显示的最大值,仅当setDrawValues()属性值为true时有用


        //Interaction with the Chart 图表的交互

        //Enabling / disabling interaction
        lineChart.setTouchEnabled(true); // 设置是否可以触摸
        lineChart.setDragEnabled(true);// 是否可以拖拽

        lineChart.setScaleEnabled(true);// 是否可以缩放 x和y轴, 默认是true
        lineChart.setScaleXEnabled(true); //是否可以缩放 仅x轴
        lineChart.setScaleYEnabled(true); //是否可以缩放 仅y轴

        lineChart.setPinchZoom(true);  //设置x轴和y轴能否同时缩放。默认是否
        lineChart.setDoubleTapToZoomEnabled(true);//设置是否可以通过双击屏幕放大图表。默认是true

        lineChart.setHighlightEnabled(false);  //If set to true, highlighting/selecting values via touch is possible for all underlying DataSets.
        lineChart.setHighlightPerDragEnabled(true);//能否拖拽高亮线(数据点与坐标的提示线),默认是true

        lineChart.setAutoScaleMinMaxEnabled(false);


        // Chart fling / deceleration
        lineChart.setDragDecelerationEnabled(true);//拖拽滚动时,手放开是否会持续滚动,默认是true(false是拖到哪是哪,true拖拽之后还会有缓冲)
        lineChart.setDragDecelerationFrictionCoef(0.99f);//与上面那个属性配合,持续滚动时的速度快慢,[0,1) 0代表立即停止。


        //Highlighting programmatically

//        highlightValues(Highlight[] highs)
//               Highlights the values at the given indices in the given DataSets. Provide null or an empty array to undo all highlighting.
//        highlightValue(int xIndex, int dataSetIndex)
//               Highlights the value at the given x-index in the given DataSet. Provide -1 as the x-index or dataSetIndex to undo all highlighting.
//        getHighlighted()
//               Returns an Highlight[] array that contains information about all highlighted entries, their x-index and dataset-index.


        //其他请参考https://github.com/PhilJay/MPAndroidChart/wiki/Interaction-with-the-Chart
        //如手势相关方法,选择回调方法


//        The Axis 坐标轴相关的,XY轴通用
        xAxis.setEnabled(true);     //是否显示X坐标轴 及 对应的刻度竖线,默认是true
        xAxis.setDrawAxisLine(true); //是否绘制坐标轴的线,即含有坐标的那条线,默认是true
        xAxis.setDrawGridLines(true); //是否显示X坐标轴上的刻度竖线,默认是true
        xAxis.setDrawLabels(true); //是否显示X坐标轴上的刻度,默认是true

        xAxis.setTextColor(Color.rgb(145, 13, 64)); //X轴上的刻度的颜色
        xAxis.setTextSize(5); //X轴上的刻度的字的大小 单位dp
//      xAxis.setTypeface(Typeface tf); //X轴上的刻度的字体
        xAxis.setGridColor(Color.rgb(145, 13, 64)); //X轴上的刻度竖线的颜色
        xAxis.setGridLineWidth(1); //X轴上的刻度竖线的宽 float类型
        xAxis.enableGridDashedLine(40, 3, 0); //虚线表示X轴上的刻度竖线(float lineLength, float spaceLength, float phase)三个参数,1.线长,2.虚线间距,3.虚线开始坐标


        //可以设置一条警戒线,如下:
        LimitLine ll = new LimitLine(40f, "警戒线");
        ll.setLineColor(Color.RED);
        ll.setLineWidth(4f);
        ll.setTextColor(Color.GRAY);
        ll.setTextSize(12f);
        // .. and more styling options
        xAxis.addLimitLine(ll);


//      X轴专用
        xAxis.setLabelsToSkip(1);    //设置坐标相隔多少,参数是int类型
        xAxis.resetLabelsToSkip();   //将自动计算坐标相隔多少
        xAxis.setAvoidFirstLastClipping(true);
        xAxis.setSpaceBetweenLabels(4);
        xAxis.setPosition(XAxis.XAxisPosition.BOTTOM_INSIDE);//把坐标轴放在上下 参数有:TOP, BOTTOM, BOTH_SIDED, TOP_INSIDE or BOTTOM_INSIDE.

//      Y轴专用
        yAxis.setStartAtZero(true);    //设置Y轴坐标是否从0开始
        yAxis.setAxisMaxValue(50);    //设置Y轴坐标最大为多少
        yAxis.resetAxisMaxValue();    //重新设置Y轴坐标最大为多少,自动调整
        yAxis.setAxisMinValue(10);    //设置Y轴坐标最小为多少
        yAxis.resetAxisMinValue();    //重新设置Y轴坐标,自动调整
        yAxis.setInverted(false);    //Y轴坐标反转,默认是false,即下小上大
        yAxis.setSpaceTop(0);    //Y轴坐标距顶有多少距离,即留白
        yAxis.setSpaceBottom(0);    //Y轴坐标距底有多少距离,即留白
        yAxis.setShowOnlyMinMax(false);    //参数如果为true Y轴坐标只显示最大值和最小值
        yAxis.setLabelCount(10, false);    //第一个参数是Y轴坐标的个数,第二个参数是 是否不均匀分布,true是不均匀分布
        yAxis.setPosition(YAxis.YAxisLabelPosition.OUTSIDE_CHART);  //参数是INSIDE_CHART(Y轴坐标在内部) 或 OUTSIDE_CHART(在外部(默认是这个))
//      yAxis.setValueFormatter(YAxisValueFormatterf);
//              Sets a custom ValueFormatter for this axis. This interface allows to format/modify
//              the original label text and instead return a customized text.

        //lineChart.setData(lineData); //添加数据

        Legend mLegend = lineChart.getLegend(); // 设置坐标线描述?? 的样式
        mLegend.setEnabled(true);
        mLegend.setTextColor(Color.rgb(255, 255, 255));// 坐标线描述文字的颜色
        mLegend.setTextSize(15);// 坐标线描述文字的大小,单位dp
//      mLegend.setTypeface(mTf);// 坐标线描述文字的字体

        mLegend.setWordWrapEnabled(true); //坐标线描述 是否 不允许出边界
        mLegend.setMaxSizePercent(0.95f);   //坐标线描述 占据的大小x%  默认0.95 即95%

        mLegend.setPosition(Legend.LegendPosition.BELOW_CHART_CENTER);//位置 RIGHT_OF_CHART, RIGHT_OF_CHART_CENTER,
        // RIGHT_OF_CHART_INSIDE, BELOW_CHART_LEFT, BELOW_CHART_RIGHT, BELOW_CHART_CENTER or PIECHART_CENTER (PieChart only), ... and more
        mLegend.setForm(Legend.LegendForm.CIRCLE);// 样式SQUARE, CIRCLE or LINE.
        mLegend.setFormSize(10f);// 大小 单位dp

        mLegend.setXEntrySpace(20f);// 条目的水平间距
        mLegend.setYEntrySpace(20f);// 条目的垂直间距
        mLegend.setFormToTextSpace(20f);//Sets the space between the legend-label and the corresponding legend-form.
    }
    public void clickMe(View view){     //添加坐标线

        LineData data = mLineChart.getData();

        if(data != null) {

            int count = (data.getDataSetCount() + 1);

            // create 10 y-vals
            ArrayList<Entry> yVals = new ArrayList<Entry>();

            if(data.getXValCount() == 0) {
                // add 10 x-entries
                for (int i = 0; i < 10; i++) {
                    data.addXValue("" + (i+1));
                }
            }

            for (int i = 0; i < data.getXValCount(); i++) {
                yVals.add(new Entry((float) (Math.random() * 50f) + 50f * count, i));
            }

            LineDataSet set = new LineDataSet(yVals, "DataSet " + count);
            set.setLineWidth(2.5f);
            set.setCircleSize(4.5f);

            int color = Color.rgb(255,0,0);

            set.setColor(color);
            set.setCircleColor(color);      //设置结点圆圈的颜色
            set.setHighLightColor(Color.rgb(0,255,0));  //设置 坐标提示线的颜色
            set.setValueTextSize(30f);      //设置坐标提示文字的大小
            set.setValueTextColor(Color.rgb(0,0,255));  //设置坐标提示文字的颜色

            data.addDataSet(set);
            mLineChart.notifyDataSetChanged();
            mLineChart.invalidate();
        }
    }
    public void clickMe2(View view) {   //删除坐标线

        LineData data = mLineChart.getData();

        if(data != null) {

            data.removeDataSet(data.getDataSetByIndex(data.getDataSetCount() - 1));

            mLineChart.notifyDataSetChanged();
            mLineChart.invalidate();
        }
    }


    private LineData getLineData() {

        ArrayList<Entry> valsComp1 = new ArrayList<Entry>();     //坐标点的集合
        ArrayList<Entry> valsComp2 = new ArrayList<Entry>();

        Entry c1e1 = new Entry(100.000f, 1); //坐标点的值,Entry(Y坐标,X坐标);
        valsComp1.add(c1e1);
        Entry c1e2 = new Entry(50.000f, 2);
        valsComp1.add(c1e2);
        Entry c1e3 = new Entry(60.000f, 3);
        valsComp1.add(c1e3);
        Entry c1e4 = new Entry(70.000f, 4);
        valsComp1.add(c1e4);

        Entry c2e1 = new Entry(30.000f, 1); //坐标点的值,Entry(Y坐标,X坐标);
        valsComp2.add(c2e1);
        Entry c2e2 = new Entry(80.000f, 2);
        valsComp2.add(c2e2);
        Entry c2e3 = new Entry(30.000f, 3); //坐标点的值,Entry(Y坐标,X坐标);
        valsComp2.add(c2e3);
        Entry c2e4 = new Entry(90.000f, 4);
        valsComp2.add(c2e4);

        LineDataSet setComp1 = new LineDataSet(valsComp1, "Company");    //坐标线,LineDataSet(坐标点的集合, 线的描述或名称);
        LineDataSet setComp2 = new LineDataSet(valsComp2, "Company");
        setComp1.setAxisDependency(YAxis.AxisDependency.LEFT);     //以左边坐标轴为准 还是以右边坐标轴为基准
        setComp2.setAxisDependency(YAxis.AxisDependency.LEFT);

        setComp1.setColors(new int[]{R.color.red1, R.color.red2, R.color.red3, R.color.red4}, this);
        setComp2.setColors(new int[]{R.color.green1, R.color.green2, R.color.green3, R.color.green4}, this);
        ArrayList<LineDataSet> dataSets = new ArrayList<LineDataSet>(); //坐标线的集合。
        dataSets.add(setComp1);
        dataSets.add(setComp2);

        ArrayList<String> xVals = new ArrayList<String>();      //X坐标轴的值的集合
        xVals.add("1.Q"); xVals.add("2.Q"); xVals.add("3.Q"); xVals.add("4.Q");
        xVals.add("1.Q"); xVals.add("2.Q"); xVals.add("3.Q"); xVals.add("4.Q");

        LineData data = new LineData(xVals, dataSets);  //LineData(X坐标轴的集合, 坐标线的集合);
        mLineChart.setData(data);   //为图表添加 数据
        mLineChart.invalidate(); // 重新更新显示

        return data;
    }

}
动画:
所有的图表类型都支持下面三种动画,分别是x方向,y方向,xy方向。
animateX(int durationMillis): x轴方向animateY(int durationMillis): y轴方向animateXY(int xDuration, int yDuration): xy轴方向
mChart.animateX(3000f); // animate horizontal 3000 milliseconds
// or:
mChart.animateY(3000f); // animate vertical 3000 milliseconds
// or:
mChart.animateXY(3000f, 3000f); // animate horizontal and vertical 3000 milliseconds
注意:如果调用动画方法后,就没有必要调用invalidate()方法,来刷新界面了。
注:写作本文是基于MPAndroidChart的版本:mpandroidchartlibrary-2-1-3.jar
现在,先做一个基础的AndroidMPChart折线图,折线图在平时的统计图表中应用最多,AndroidMPChart提供了丰富的功能给予支持。
效果图如下:
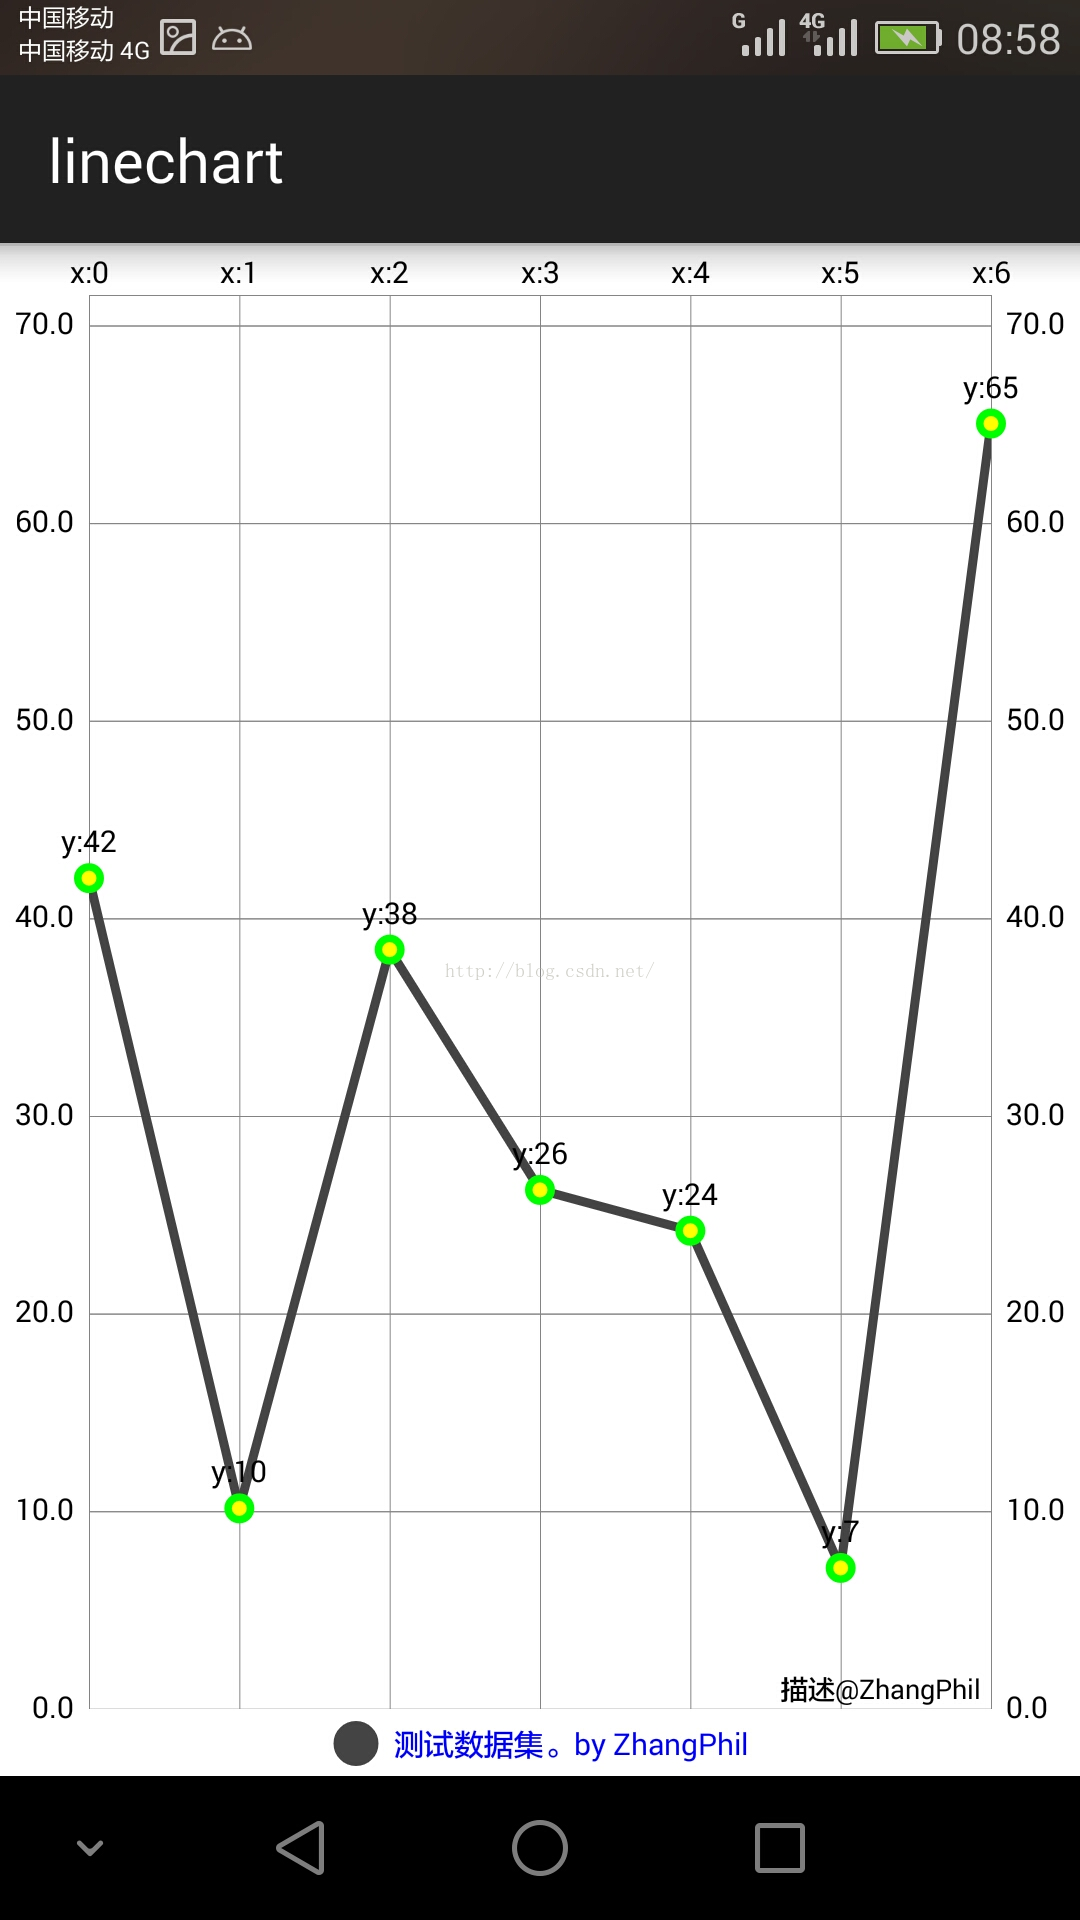
现给出实现上述统计图表的全部代码。
MainActivity.java的代码:
package zhangphil.linechart;

import java.util.ArrayList;

import com.github.mikephil.charting.charts.LineChart;
import com.github.mikephil.charting.components.Legend;
import com.github.mikephil.charting.components.Legend.LegendForm;
import com.github.mikephil.charting.components.Legend.LegendPosition;
import com.github.mikephil.charting.data.Entry;
import com.github.mikephil.charting.data.LineData;
import com.github.mikephil.charting.data.LineDataSet;
import com.github.mikephil.charting.utils.ValueFormatter;

import android.support.v7.app.ActionBarActivity;
import android.graphics.Color;
import android.os.Bundle;

public class MainActivity extends ActionBarActivity {

	@Override
	protected void onCreate(Bundle savedInstanceState) {
		super.onCreate(savedInstanceState);
		setContentView(R.layout.activity_main);

		LineChart chart = (LineChart) findViewById(R.id.chart);

		// 制作7个数据点(沿x坐标轴)
		LineData mLineData = makeLineData(7);
		setChartStyle(chart, mLineData, Color.WHITE);
	}

	// 设置chart显示的样式
	private void setChartStyle(LineChart mLineChart, LineData lineData,
			int color) {
		// 是否在折线图上添加边框
		mLineChart.setDrawBorders(false);

		mLineChart.setDescription("描述@ZhangPhil");// 数据描述

		// 如果没有数据的时候,会显示这个,类似listview的emtpyview
		mLineChart
				.setNoDataTextDescription("如果传给MPAndroidChart的数据为空,那么你将看到这段文字。@Zhang Phil");

		// 是否绘制背景颜色。
		// 如果mLineChart.setDrawGridBackground(false),
		// 那么mLineChart.setGridBackgroundColor(Color.CYAN)将失效;
		mLineChart.setDrawGridBackground(false);
		mLineChart.setGridBackgroundColor(Color.CYAN);

		// 触摸
		mLineChart.setTouchEnabled(true);

		// 拖拽
		mLineChart.setDragEnabled(true);

		// 缩放
		mLineChart.setScaleEnabled(true);

		mLineChart.setPinchZoom(false);

		// 设置背景
		mLineChart.setBackgroundColor(color);

		// 设置x,y轴的数据
		mLineChart.setData(lineData);

		// 设置比例图标示,就是那个一组y的value的
		Legend mLegend = mLineChart.getLegend();

		mLegend.setPosition(LegendPosition.BELOW_CHART_CENTER);
		mLegend.setForm(LegendForm.CIRCLE);// 样式
		mLegend.setFormSize(15.0f);// 字体
		mLegend.setTextColor(Color.BLUE);// 颜色

		// 沿x轴动画,时间2000毫秒。
		mLineChart.animateX(2000);
	}

	/**
	 * @param count
	 *            数据点的数量。
	 * @return
	 */
	private LineData makeLineData(int count) {
		ArrayList<String> x = new ArrayList<String>();
		for (int i = 0; i < count; i++) {
			// x轴显示的数据
			x.add("x:" + i);
		}

		// y轴的数据
		ArrayList<Entry> y = new ArrayList<Entry>();
		for (int i = 0; i < count; i++) {
			float val = (float) (Math.random() * 100);
			Entry entry = new Entry(val, i);
			y.add(entry);
		}

		// y轴数据集
		LineDataSet mLineDataSet = new LineDataSet(y, "测试数据集。by ZhangPhil");

		// 用y轴的集合来设置参数
		// 线宽
		mLineDataSet.setLineWidth(3.0f);

		// 显示的圆形大小
		mLineDataSet.setCircleSize(5.0f);

		// 折线的颜色
		mLineDataSet.setColor(Color.DKGRAY);

		// 圆球的颜色
		mLineDataSet.setCircleColor(Color.GREEN);

		// 设置mLineDataSet.setDrawHighlightIndicators(false)后,
		// Highlight的十字交叉的纵横线将不会显示,
		// 同时,mLineDataSet.setHighLightColor(Color.CYAN)失效。
		mLineDataSet.setDrawHighlightIndicators(true);

		// 按击后,十字交叉线的颜色
		mLineDataSet.setHighLightColor(Color.CYAN);

		// 设置这项上显示的数据点的字体大小。
		mLineDataSet.setValueTextSize(10.0f);

		// mLineDataSet.setDrawCircleHole(true);

		// 改变折线样式,用曲线。
		// mLineDataSet.setDrawCubic(true);
		// 默认是直线
		// 曲线的平滑度,值越大越平滑。
		// mLineDataSet.setCubicIntensity(0.2f);

		// 填充曲线下方的区域,红色,半透明。
		// mLineDataSet.setDrawFilled(true);
		// mLineDataSet.setFillAlpha(128);
		// mLineDataSet.setFillColor(Color.RED);

		// 填充折线上数据点、圆球里面包裹的中心空白处的颜色。
		mLineDataSet.setCircleColorHole(Color.YELLOW);

		// 设置折线上显示数据的格式。如果不设置,将默认显示float数据格式。
		mLineDataSet.setValueFormatter(new ValueFormatter() {

			@Override
			public String getFormattedValue(float value) {
				int n = (int) value;
				String s = "y:" + n;
				return s;
			}
		});

		ArrayList<LineDataSet> mLineDataSets = new ArrayList<LineDataSet>();
		mLineDataSets.add(mLineDataSet);

		LineData mLineData = new LineData(x, mLineDataSets);

		return mLineData;
	}
}
MainActivity.java需要的activity_main.xml :
<RelativeLayout xmlns:android="http://schemas.android.com/apk/res/android"
    xmlns:tools="http://schemas.android.com/tools"
    android:layout_width="match_parent"
    android:layout_height="match_parent" >

	<com.github.mikephil.charting.charts.LineChart
        android:id="@+id/chart"
        android:layout_width="match_parent"
        android:layout_height="match_parent" />

</RelativeLayout>
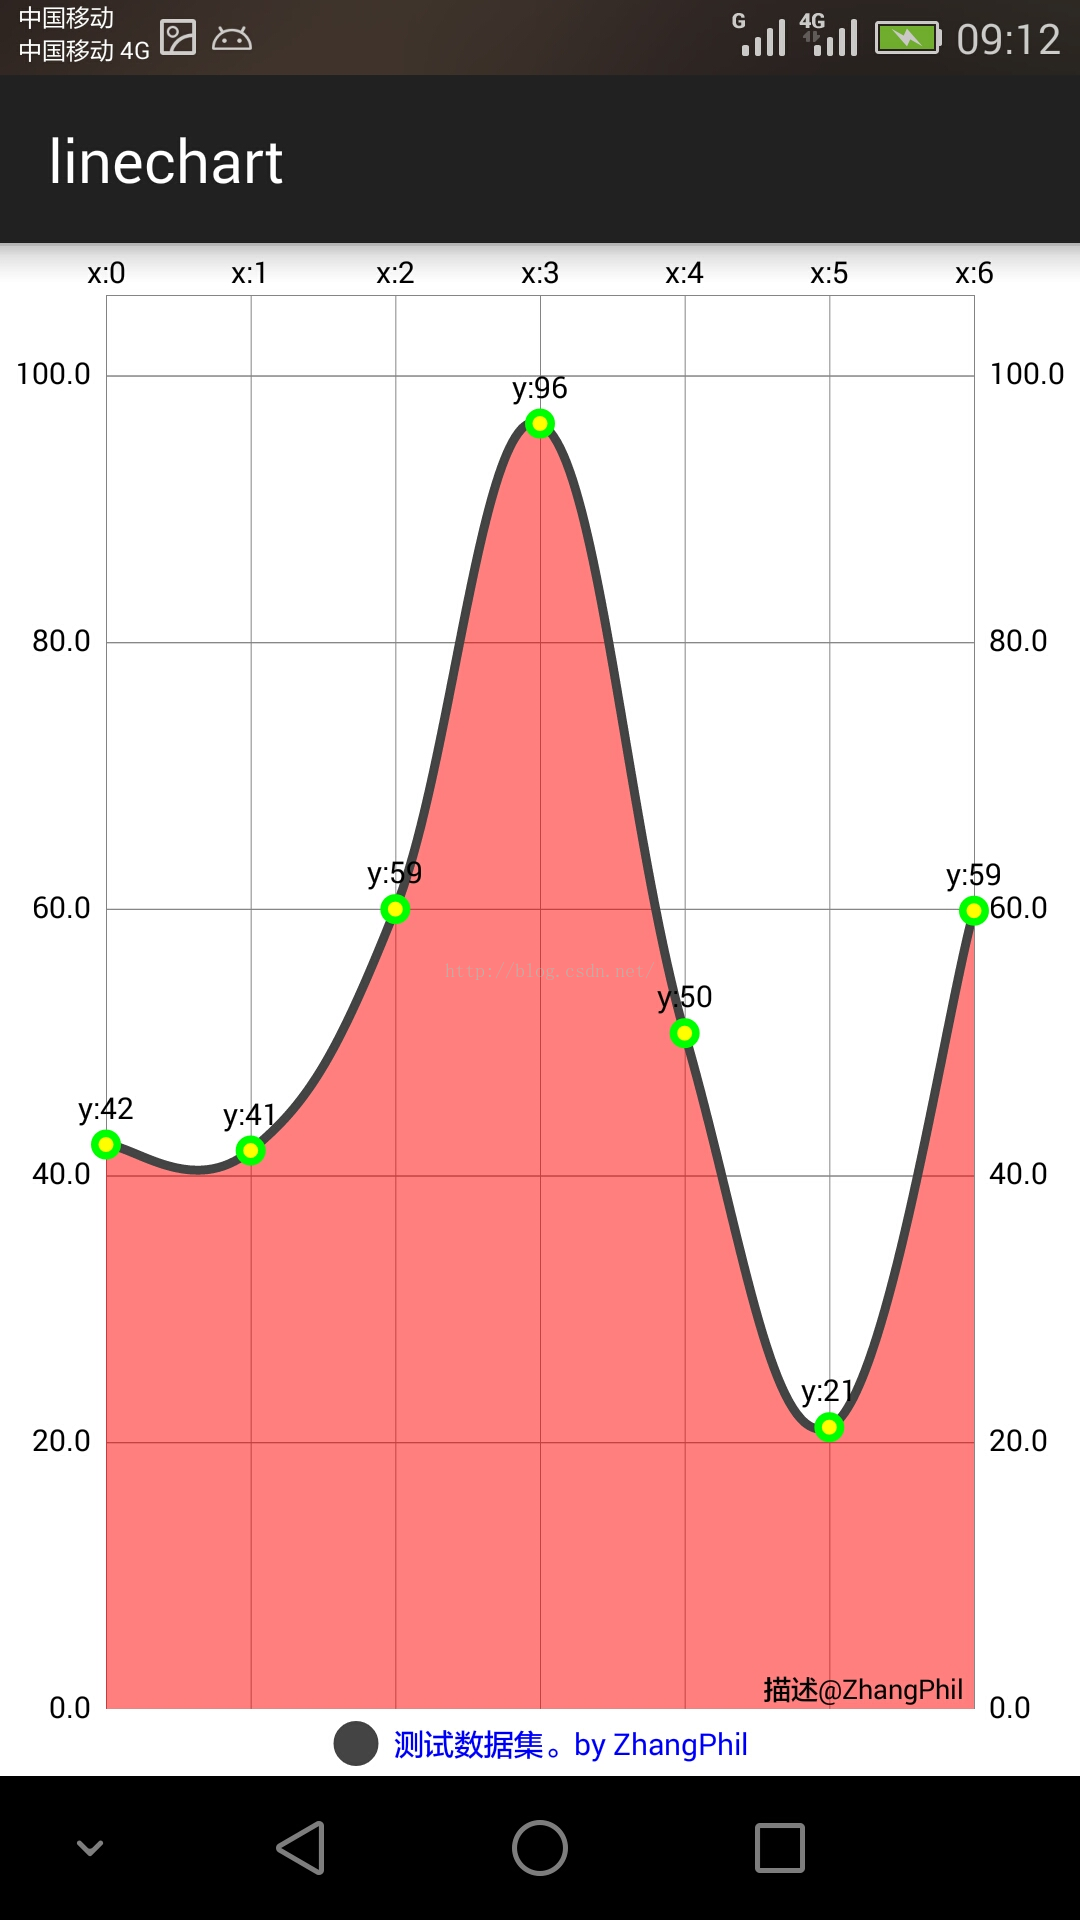
MPAndroidChart提供了丰富的参数设计条件,可以设计样式丰富统计图表,比如在本例中,如果把注释掉的这段代码重新启用:
// 改变折线样式,用曲线。
		// mLineDataSet.setDrawCubic(true);
		// 默认是直线
		// 曲线的平滑度,值越大越平滑。
		// mLineDataSet.setCubicIntensity(0.2f);

		// 填充曲线下方的区域,红色,半透明。
		// mLineDataSet.setDrawFilled(true);
		// mLineDataSet.setFillAlpha(128);
		// mLineDataSet.setFillColor(Color.RED);
那么折线图的样式就变成这样:


 6263
6263

 被折叠的 条评论
为什么被折叠?
被折叠的 条评论
为什么被折叠?
 到【灌水乐园】发言


