


内存泄漏工具和分析:
1.Eclipse中使用:比较麻烦 需要集成3个jiar然后 进行配置。具体可以看:
简单的说
1.加载 DisplayLeakActivity(展示UI). LeakAnalyzer(分析),LeakWatcher.(监听)
2.项目添加依赖项目:DisplayLeakActivity
3.新建一个Application
public class LeakcanaryApp extends Application{

	private RefWatcher refWatcher;

	@Override
	public void onCreate() {
		refWatcher = LeakCanary.install(this);
	}
	public static RefWatcher getRefWatcher(Context context) {
		LeakcanaryApp application = (LeakcanaryApp) context.getApplicationContext();
		return application.refWatcher;
	}
}
4.Activity中注册监听
protected void onCreate(Bundle savedInstanceState) {
		super.onCreate(savedInstanceState);
		setContentView(R.layout.activity_main);
		RefWatcher refWatcher = LeakcanaryApp.getRefWatcher(this);
		refWatcher.watch(this);

	}
5。AndroidManifest.xml文件中申请 权限和声明组件
<uses-permission android:name="android.permission.WRITE_EXTERNAL_STORAGE" />


 <!-- 测试内存泄漏检测需要的组件-->
        <service
            android:name="com.squareup.leakcanary.internal.HeapAnalyzerService"
            android:enabled="false"
            android:process=":leakcanary" />
        <service
            android:name="com.squareup.leakcanary.DisplayLeakService"
            android:enabled="false" />

        <activity
            android:name="com.squareup.leakcanary.internal.DisplayLeakActivity"
            android:enabled="false"
            android:icon="@drawable/leak_canary_icon"
            android:label="@string/leak_canary_display_activity_label"
            android:taskAffinity="com.squareup.leakcanary"
            android:theme="@style/leak_canary_LeakCanary.Base" >
            <intent-filter>
                <action android:name="android.intent.action.MAIN" />

                <category android:name="android.intent.category.LAUNCHER" />
            </intent-filter>
        </activity>
        <activity
            android:name="com.squareup.leakcanary.internal.RequestStoragePermissionActivity"
            android:enabled="false"
            android:icon="@drawable/leak_canary_icon"
            android:label="@string/leak_canary_storage_permission_activity_label"
            android:taskAffinity="com.squareup.leakcanary"
            android:theme="@style/leak_canary_Theme.Transparent" />
6.完成,开始测试:
也可以用命令:dumpsys meminfo 7290 查看内存情况:
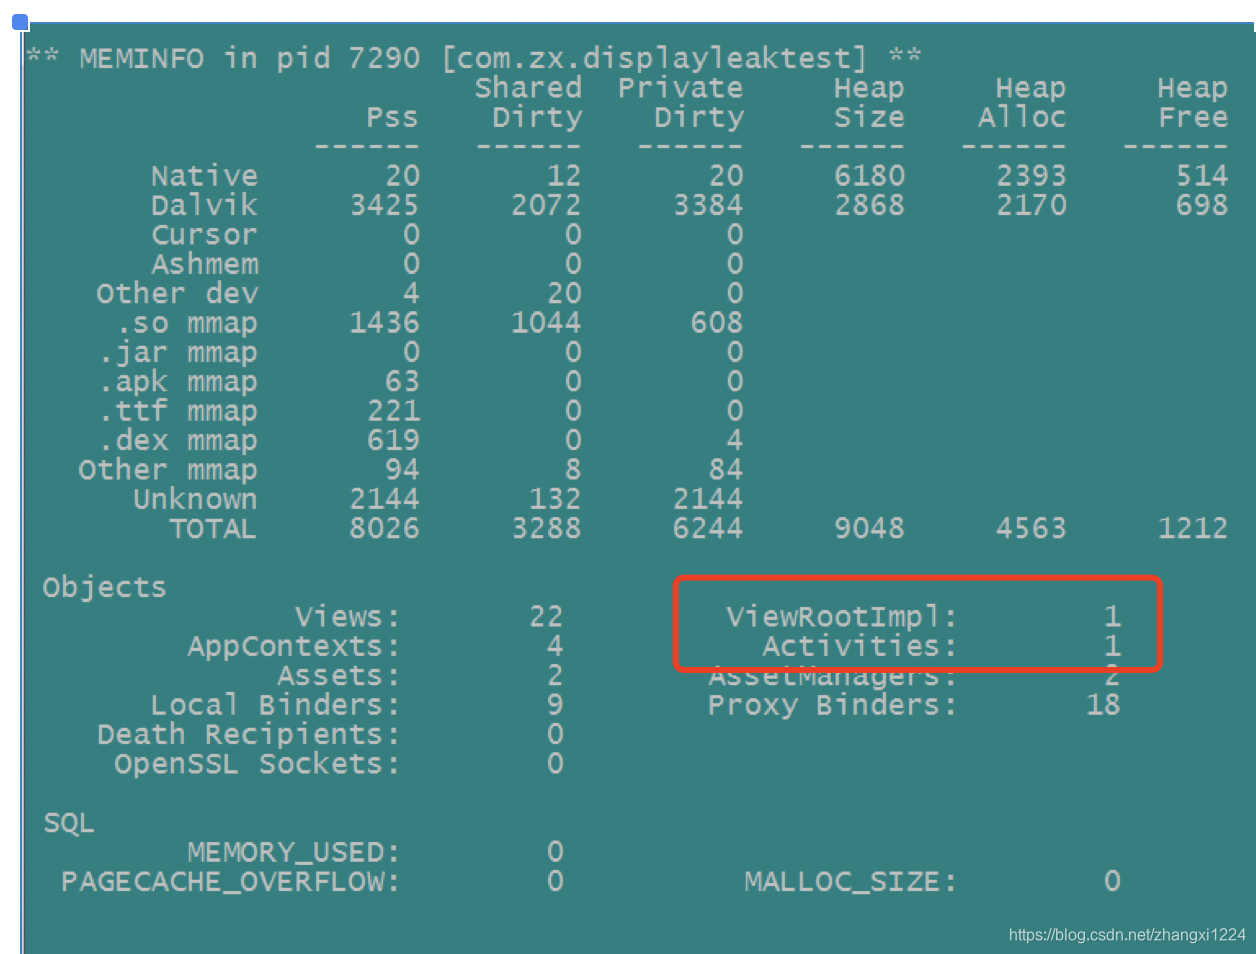
如上图红框,如果发生泄漏,那Activityes会不断往上涨。
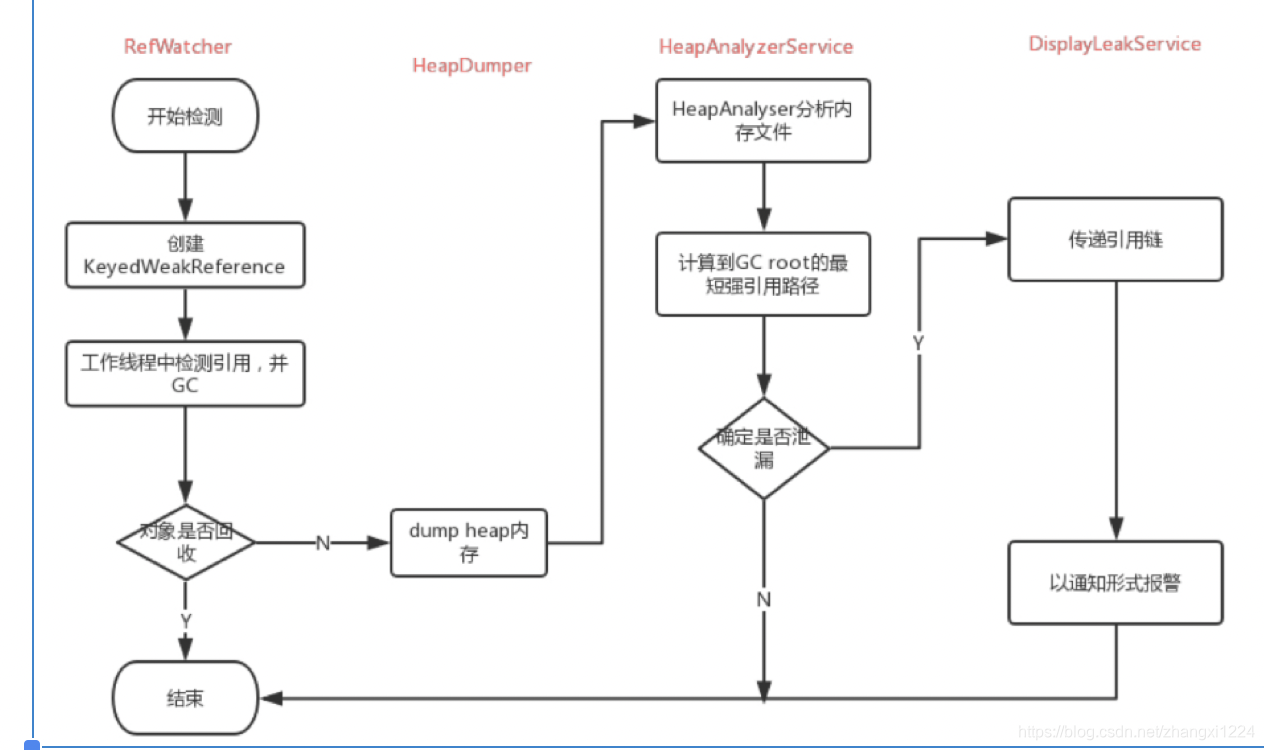
也可以通过 Leakcanary的打印分析:
内存泄漏的根本原因就是 对象被强引用着。
gc root 强引用 有以下3种:
1.虚拟机栈中的局部变量引用
2.native栈中的局部变量
3.静态变量和静态常量
开始分析其实现原理: 先要明白 java的4种引用机制。Reference
1.强引用
2.软引用
3.弱引用
4.虚引用
局部变量离开作用域后会被置空
对于简单对象, 当调用它的方法执行完毕后, 指向它的引用会被从stack中popup
Reference
主要是负责内存的一个状态,当然它还和java虚拟机,垃圾回收器打交道。Reference类首先把内存分为4种状态Active,Pending,Enqueued,Inactive。
Active,一般来说内存一开始被分配的状态都是 Active,
Pending 大概是指快要被放进队列的对象,也就是马上要回收的对象,
Enqueued 就是对象的内存已经被回收了,我们已经把这个对象放入到一个队列中,方便以后我们查询某个对象是否被回收,
Inactive就是最终的状态,不能再变为其它状态。
ReferenceQueue
引用队列,当检测到对象的可到达性更改时,垃圾回收器将已注册的引用对象添加到队列中,ReferenceQueue实现了入队(enqueue)和出队(poll),还有remove操作,内部元素head就是泛型的Reference。
当我们想检测一个对象是否被回收了,那么我们就可以采用 Reference + ReferenceQueue,大概需要几个步骤:
创建一个引用队列 queue
创建 Reference 对象,并关联引用队列 queue
在 reference 被回收的时候,Reference 会被添加到 queue 中
一个简单的例子:如果对象没有被回收则一直会在,如果被回收了。则会获取到引用对象。
ReferenceQueue queue = new ReferenceQueue();
		System.out.println("queue==" + queue);
		Car car = new Car(22000, "silver");
		System.out.println("car==" + car);
		WeakReference<Car> weakCar = new WeakReference<Car>(car, queue);
		System.out.println("weakCar==" + weakCar);
		car = null;
		System.out.println("weakCar.get()==" + weakCar.get());
		if (weakCar.get() != null) {
			System.out.println("Object is alive ");
		} else {
			System.out.println("Object has been collected.");
		}
		System.out.println("System.gc()-----");
		System.gc();
		try {
			Thread.sleep(500);
			System.out.println("------------------------");
			System.out.println("22 car=" + car);
			System.out.println("22 weakCar==" + weakCar);
			System.out.println("22 weakCar.get()==" + weakCar.get());
			if (weakCar.get() != null) {
				System.out.println("2222 Object is alive ");
			} else {
				System.out.println("2222 Object has been collected.");
			}
			System.out.println("------------------------");
			System.out.println("queue.remove()");
			Reference reference1 = queue.remove();
			System.out.println("33 car=" + car);
			System.out.println("33 weakCar==" + weakCar);
			System.out.println("33 weakCar.get()==" + weakCar.get());
			System.out.println("33 queue==" + queue);
			System.out.println("33 Reference=" + reference1);

		} catch (InterruptedException e) {
			System.out.println("InterruptedException=" + e.toString());
		}
运行结果:
如果把car=null注释:
线程就进入wait状态。
继续看Leakcanary源码。
LeakCanary 的原理总结如下
监听 Activity 的生命周期
在 onDestroy 的时候,创建相应的 Refrence 和 RefrenceQueue,并启动后台进程去检测
一段时间之后,从 RefrenceQueue 读取,若读取不到相应 activity 的 Refrence,有可能发生泄露了,这个时候,再促发 gc,一段时间之后,再去读取,若在从 RefrenceQueue 还是读取不到相应 activity 的 refrence,可以断定是发生内存泄露了
发生内存泄露之后,dump,分析 hprof 文件,找到泄露路径(使用 haha 库分析)


 716
716


 被折叠的 条评论
为什么被折叠?
被折叠的 条评论
为什么被折叠?
 到【灌水乐园】发言


