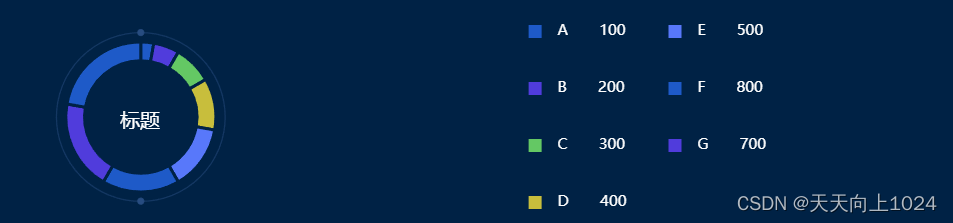
echarts 圆环图
<!DOCTYPE html>
<html lang="en">
<head>
<meta charset="UTF-8" />
<meta http-equiv="X-UA-Compatible" content="IE=edge" />
<meta name="viewport" content="width=device-width, initial-scale=1.0" />
<title>Document</title>
<script src="https://cdn.jsdelivr.net/npm/echarts@5.4.1/dist/echarts.min.js"></script>
</head>
<body>
<div
class="echarts1"
id="echarts1"
style="width: 100%; height: 250px"
></div>
<script>
const pieData = [
{ name: "A", value: "100" },
{ name: "B", value: "200" },
{ name: "C", value: "300" },
{ name: "D", value: "400" },
{ name: "E", value: "500" },
{ name: "F", value: "600" },
{ name: "G", value: "700" },
{ name: "F", value: "800" },
];
const color = [
"rgb(30,90,200)",
"rgb(80,60,220)",
"rgb(100,200,100)",
"rgb(200,190,60)",
"rgb(88,120,250)",
];
const angle = 0;
const value = [];
function getCirlPoint(x0, y0, r, angle) {
const x1 = x0 + r * Math.cos((angle * Math.PI) / 180);
const y1 = y0 + r * Math.sin((angle * Math.PI) / 180);
return {
x: x1,
y: y1,
};
}
const formatNumber = function(num) {
const reg = /(?=(\B)(\d{3})+$)/g;
return num.toString().replace(reg, ",");
};
const myChart = echarts.init(document.getElementById("echarts1"));
const option = {
backgroundColor: "rgb(0,34,69)",
color: color,
tooltip: {
trigger: "item",
},
title: [
{
text: "{name|" + "标题" + "}",
top: "center",
left: "17.6%",
textStyle: {
rich: {
name: {
fontSize: 20,
fontWeight: "normal",
color: "#fff",
padding: [10, 0, 0, 20],
},
val: {
fontSize: 32,
fontWeight: "bold",
color: "rgb(61,153,252)",
padding: [0, 10, 0, 15],
},
c: {
fontSize: 15,
fontWeight: "normal",
color: "rgb(132,159,186)",
},
},
},
},
],
legend: {
orient: "vertical",
icon: "rect",
x: "40%",
y: "center",
itemWidth: 15,
itemHeight: 15,
itemGap: 40,
align: "left",
textStyle: {
color: "#fff",
fontSize: 15,
padding: [0, 0, 0, 10],
},
formatter(name) {
const then = option.series[0].data;
let total = 0;
for (let i = 0; i < then.length; i++) {
if (
then[i].name != "" &&
then[i].name != null &&
then[i].name != undefined
) {
total += parseInt(then[i].value);
}
}
var str = "";
var p = 0;
for (let i = 0; i < then.length; i++) {
if (then[i].name == name) {
p = then[i].value;
str = name + " " + p;
}
}
return str;
},
},
series: [
{
type: "pie",
radius: ["45%", "60%"],
center: ["20%", "50%"],
data: pieData,
hoverAnimation: false,
itemStyle: {
normal: {
borderColor: "rgb(0,34,69)",
borderWidth: 3,
},
},
labelLine: {
normal: {
show: false,
length: 20,
length2: 120,
lineStyle: {
color: "#e6e6e6",
},
},
},
label: {
normal: {
show: false,
formatter: (params) => {
return (
"{icon|●}{name|" +
params.name +
"}{value|" +
formatNumber(params.value) +
"}"
);
},
padding: [0, -100, 25, -100],
rich: {
icon: {
fontSize: 16,
},
name: {
fontSize: 14,
padding: [0, 10, 0, 4],
color: "#666666",
},
value: {
fontSize: 18,
fontWeight: "bold",
color: "#333333",
},
},
},
},
},
{
name: "",
tooltip: {
show: false,
},
type: "pie",
radius: ["68%", "67%"],
center: ["20%", "50%"],
hoverAnimation: false,
itemStyle: {
normal: {
label: {
show: false,
color: "white",
},
},
},
data: [
{
value: 50,
name: "",
itemStyle: {
normal: {
color: " #274C80",
opacity: 0.5,
},
},
},
],
},
{
name: "",
type: "custom",
coordinateSystem: "none",
renderItem: function(params, api) {
const x0 = (31 * api.getWidth()) / 155;
const y0 = api.getHeight() / 2.97;
const r = Math.min(api.getWidth(), api.getHeight()) / 2;
const point = getCirlPoint(x0, y0, r, 90 + -angle);
return {
type: "circle",
shape: {
cx: point.x,
cy: point.y,
r: 3,
},
style: {
stroke: "#274C80",
fill: "#274C80",
},
silent: true,
};
},
data: [0],
},
{
name: "",
type: "custom",
coordinateSystem: "none",
renderItem: function(params, api) {
const x0 = (31 * api.getWidth()) / 155;
const y0 = api.getHeight() / 1.51;
const r = Math.min(api.getWidth(), api.getHeight()) / 2;
const point = getCirlPoint(x0, y0, r, 270 + -angle);
return {
type: "circle",
shape: {
cx: point.x,
cy: point.y,
r: 3,
},
style: {
stroke: "#274C80",
fill: "#274C80",
},
silent: true,
};
},
data: [0],
},
],
};
myChart.setOption(option);
window.onresize = function() {
myChart.resize();
};
</script>
</body>
</html>


 1969
1969

 被折叠的 条评论
为什么被折叠?
被折叠的 条评论
为什么被折叠?
 到【灌水乐园】发言


