


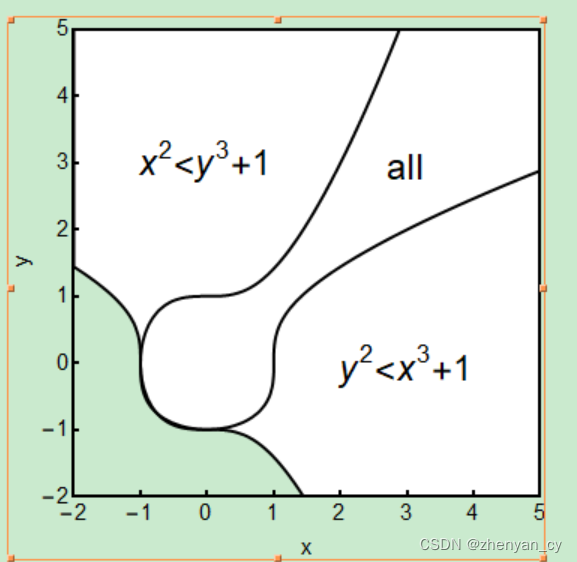
函数:RegionPlot
Clear["`*"];
RegionPlot[{x^2 < y^3 + 1, y^2 < x^3 + 1}, {x, -2, 5}, {y, -2, 5},
 PlotStyle -> White, PlotRangePadding -> 0, FrameLabel -> {"x", "y"},
 BoundaryStyle -> Directive[15, Thick, Black],
 FrameTicks -> {{{-2, -1, 0, 1, 2, 3, 4, 5},
    None}, {{-2, -1, 0, 1, 2, 3, 4, 5}, None}}, Frame -> True,
 FrameStyle -> Directive[15, Thick, Black],
 Epilog -> {Text[
    Style["\!\(\*SuperscriptBox[\(x\), \(2\)]\)<\!\(\*SuperscriptBox[\
\(y\), \(3\)]\)+1", 24], {-0.01, 3}],
   Text[Style["all", 24], {3.0, 2.9}],
   Text[Style[
     "\!\(\*SuperscriptBox[\(y\), \
\(2\)]\)<\!\(\*SuperscriptBox[\(x\), \(3\)]\)+1", 24], {3, -0.07}]}]
结果展示:


 4378
4378


 被折叠的 条评论
为什么被折叠?
被折叠的 条评论
为什么被折叠?
 到【灌水乐园】发言


