


 本文介绍了如何在MATLABR2018a中创建一个AveragingFilter函数,使用滑动窗口处理信号,然后将其转换为可生成的代码,并应用到噪声正弦波上,展示了结果的可视化。
参考:https://ww2.mathworks.cn/help/releases/R2020b/coder/gs/averaging-filter.html
matlab版本R2018a。
1、新建function文件
文件名averaging_filter.m
内容如下:
% y = averaging_filter(x)
% Take an input vector signal 'x' and produce an output vector signal 'y' with
% same type and shape as 'x' but filtered.
function y = averaging_filter(x) %#codegen
% Use a persistent variable 'buffer' that represents a sliding window of
% 16 samples at a time.
persistent buffer;
if isempty(buffer)
    buffer = zeros(16,1);
end
y = zeros(size(x), class(x));
for i = 1:numel(x)
    % Scroll the buffer
    buffer(2:end) = buffer(1:end-1);
    % Add a new sample value to the buffer
    buffer(1) = x(i);
    % Compute the current average value of the window and
    % write result
    y(i) = sum(buffer)/numel(buffer);
end

%#codegen 编译指令指示 MATLAB 代码用于代码生成。
%#codegen 编译指令指示 MATLAB 代码用于代码生成。
2、创建一些样本数据
生成噪声正弦波并绘制结果。
v = 0:0.00614:2*pi;
x = sin(v) + 0.3*rand(1,numel(v));
plot(x, 'red');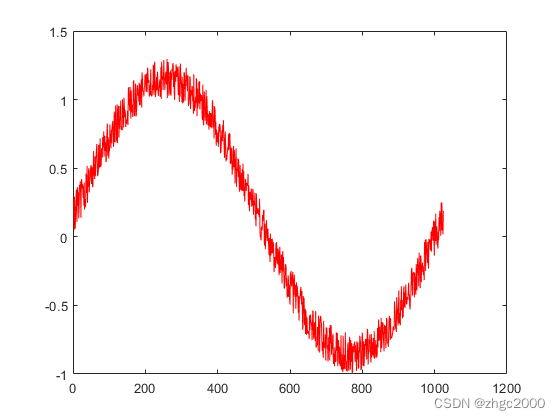
3、使用APP选项下的MATLAB CODER生成代码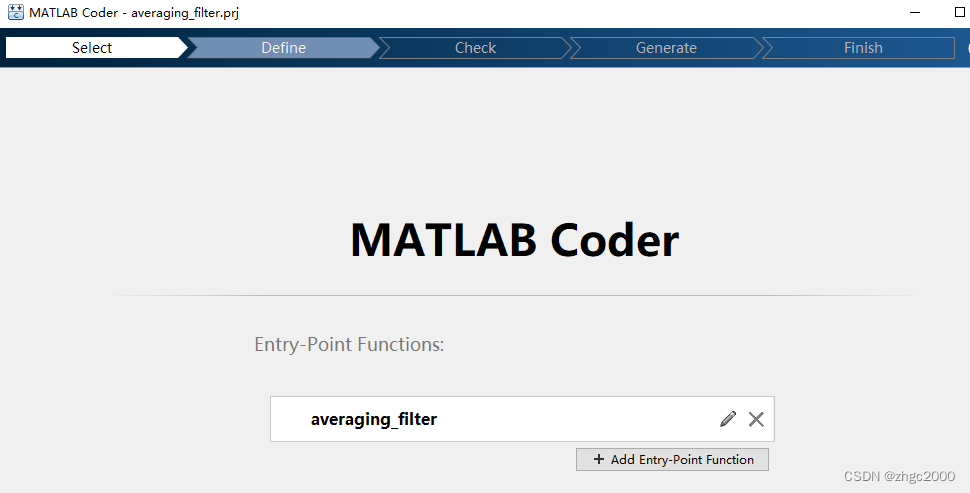
select 文件averaging_filter.m,next;
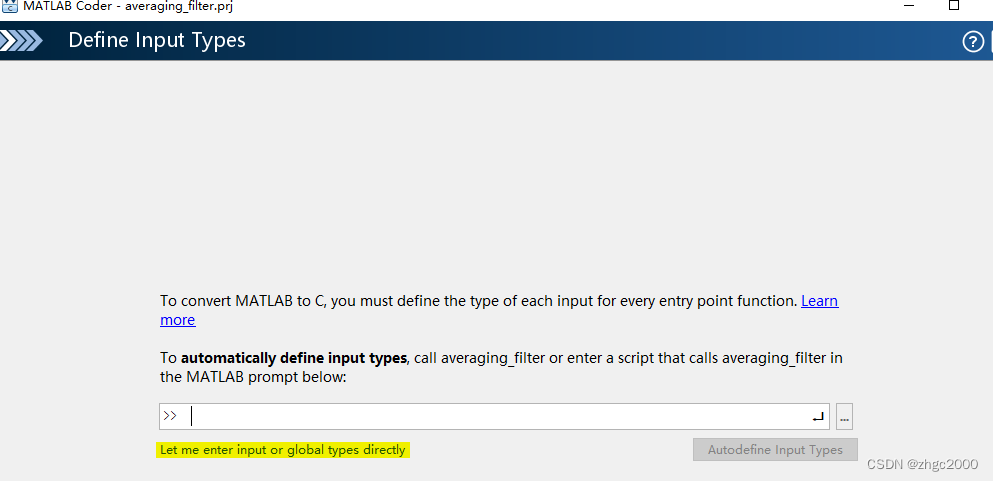
点击Let me enter input or global types directly

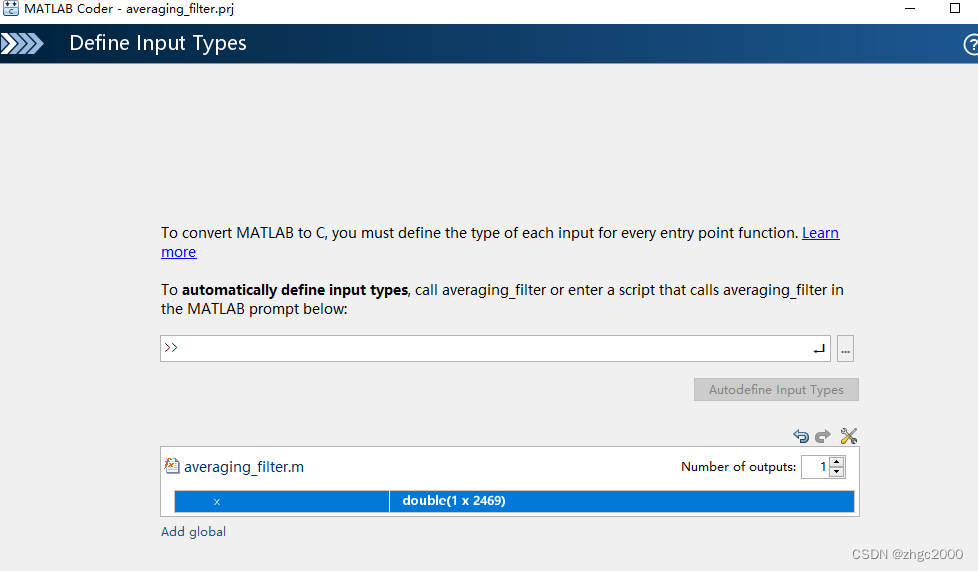
点击click to define,选define by example,选工作区变量x(上面输入的样本数据),next
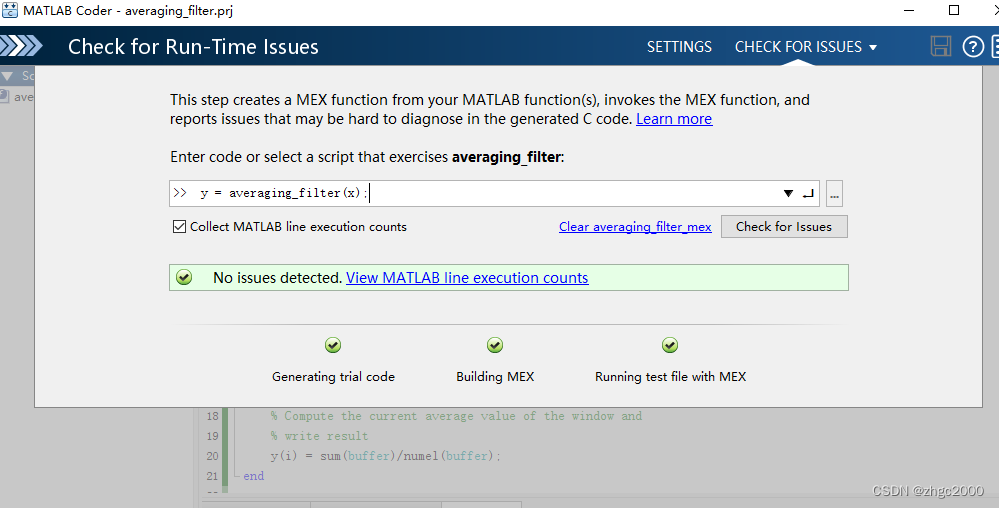
输入 y = averaging_filter(x);点击check for issuse;检查输入命令执行情况OK。
或直接不输入,点击next。
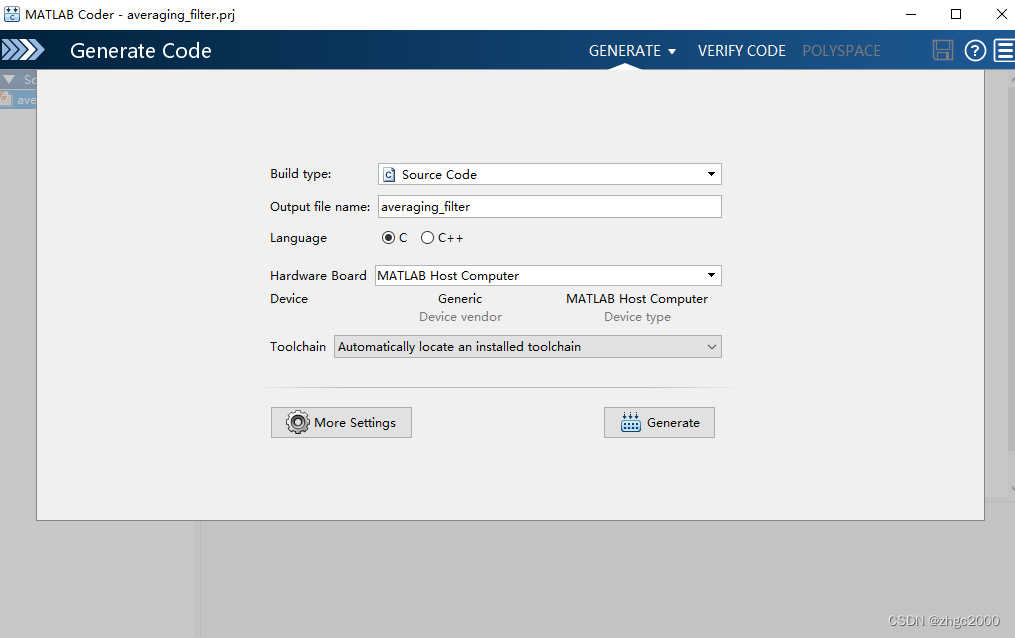
点击generate生成代码
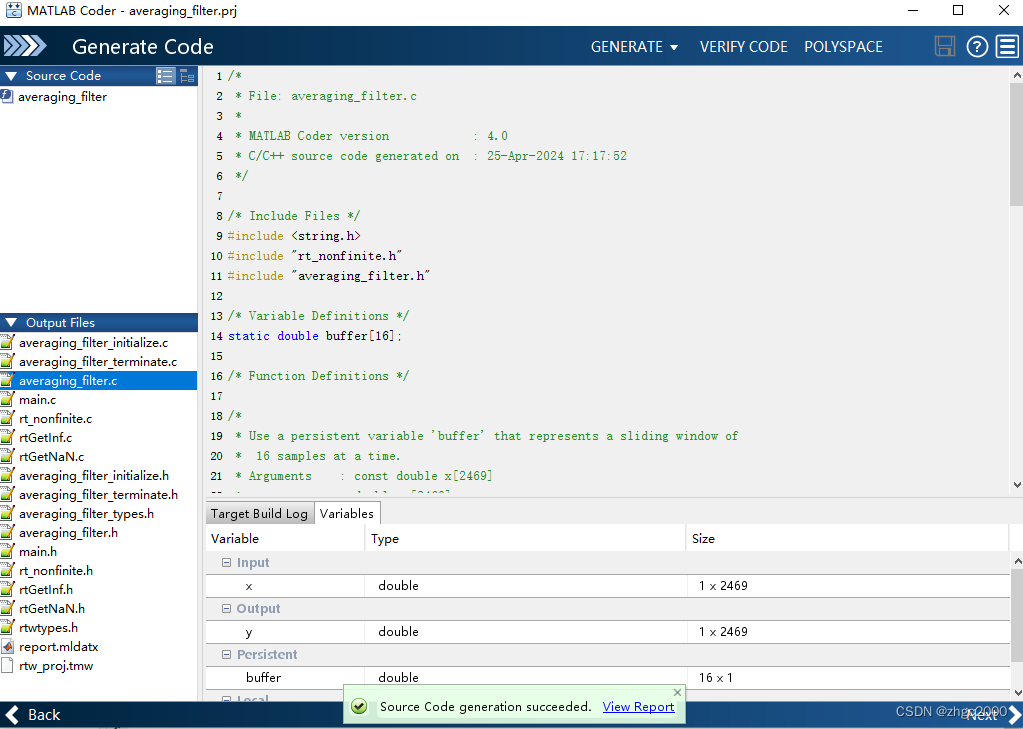
完成。
附测试代码及效果:
y = averaging_filter(x);
% Plot the result when the MEX function is applied to the noisy sine wave.
% The 'hold on' command ensures that the plot uses the same figure window as
% the previous plot command.
hold on;
plot(y, 'blue');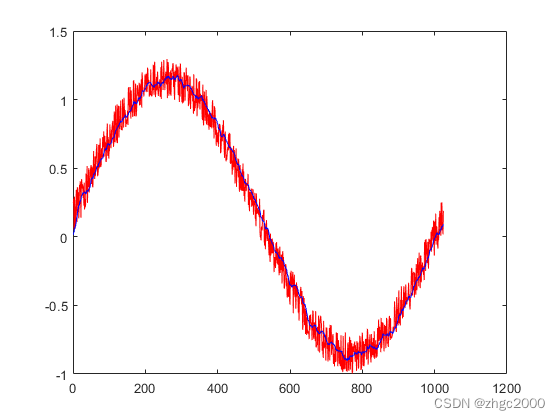


 1932
1932

 被折叠的 条评论
为什么被折叠?
被折叠的 条评论
为什么被折叠?
 到【灌水乐园】发言


