


Prometheus基于Golang编写,编译后的软件包,不依赖于任何的第三方依赖。用户只需要下载对应平台的二进制包,解压并且添加基本的配置即可正常启动Prometheus Server。
Promtheus作为一个时间序列数据库,其采集的数据会以文件的形似存储在本地中,默认的存储路径为data/,也可以通过参数--storage.tsdb.path="data/"修改本地数据存储的路径。
Prometheus具有以下特性:
① 多维的数据模型(基于时间序列的Key、value键值对)
② 灵活的查询和聚合语言PromQL(难)
③ 提供本地存储和分布式存储
④ 通过基于HTTP和HTTPS的Pull模型采集时间序列数据(pull数据的拉取,时间序列:每段
时间点的数据值指标,持续性的产生。横轴标识时间,纵轴为数据值,一段时间内数值的动态变化,所有的点连线形成大盘式的折线图)
⑤ 可利用Pushgateway (Prometheus的可选中间件)实现Push模式
⑥ 可通过动态服务发现或静态配置发现目标机器(通过consul自动发现和收缩)
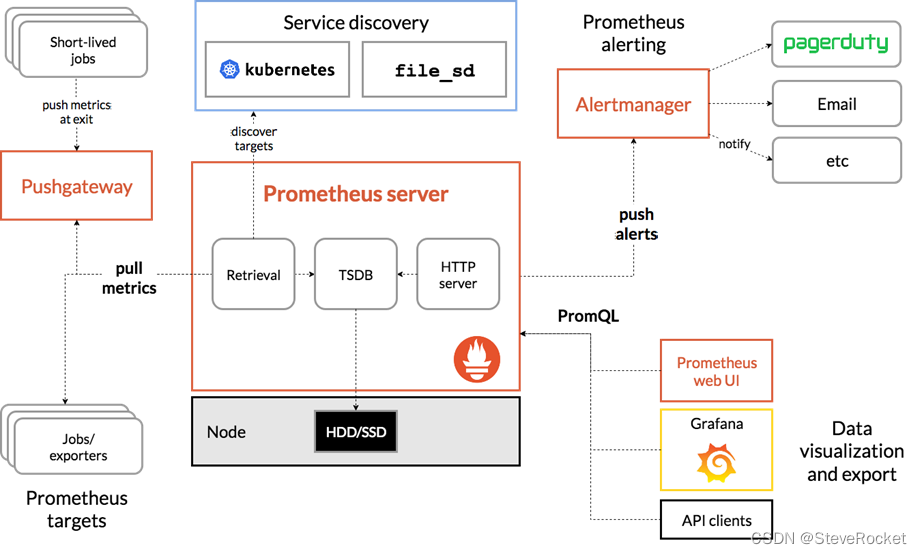
Prometheus架构与生态系统组成
Prometheus安装
或
https://download.csdn.net/download/zhouruifu2015/87579035
- Windows环境
下载完成后,解压压缩包,直接运行prometheus.exe即可,prometheus.yml即为默认配置文件。启动prometheus服务,其会默认加载当前路径下的prometheus.yml文件
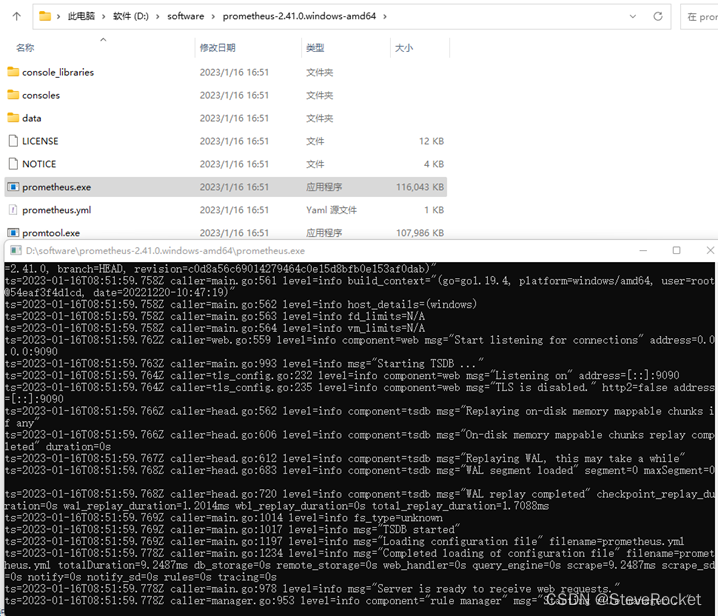
prometheus.exe --web.console.libraries="console_libraries" --web.console.templates="consoles"
- Linux环境
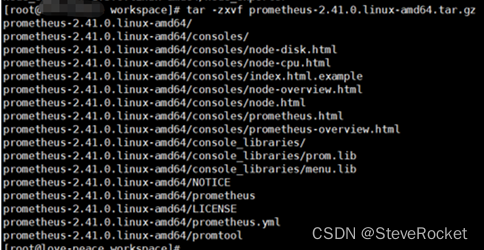
下载并解压,软件包放在Linux任何位置下进行解压,此处为在root目录下创建的workspace目录,如: /root/workspace/prometheus-2.41.0.linux-amd64
相对路径启动服务并绑定端口
./prometheus --web.console.libraries=console_libraries --web.console.templates=consoles --config.file=prometheus.yml --web.listen-address=0.0.0.0:9095 --web.enable-lifecycle
绝对路径启动服务
/usr/local/prometheus/bin/prometheus --web.console.libraries=/usr/local/prometheus/bin/console_libraries --web.console.templates=/usr/local/prometheus/bin/consoles --config.file=/usr/local/prometheus/etc/prometheus.yml --storage.tsdb.path=/usr/local/prometheus/data --web.listen-address=0.0.0.0:9090 --web.enable-lifecycle
Docker镜像的方式启动服务
docker run -p 9090:9090 -v /etc/prometheus/prometheus.yml:/etc/prometheus/prometheus.yml prom/prometheus
服务验证
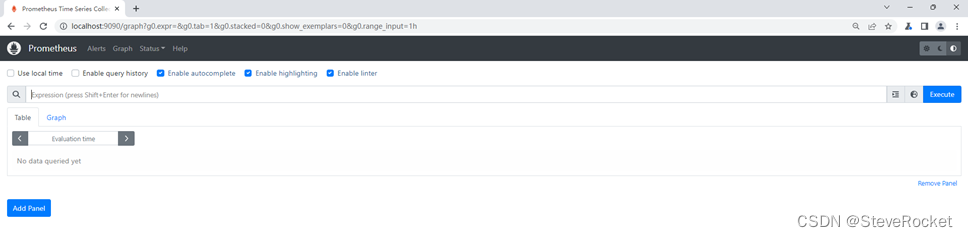
Prometheus默认端口是9090,在浏览器输入:localhost:9090能访问即可
Prometheus配置详解和示例
默认配置
绑定node和规则配置
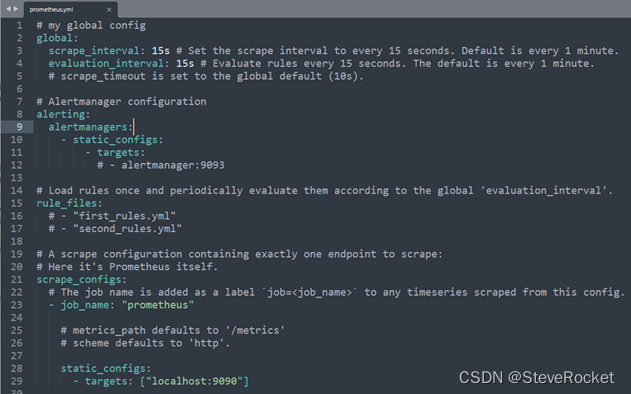
# my global config
global:
  scrape_interval: 15s # Set the scrape interval to every 15 seconds. Default is every 1 minute.
  evaluation_interval: 15s # Evaluate rules every 15 seconds. The default is every 1 minute.
  # scrape_timeout is set to the global default (10s).

# Alertmanager configuration

alerting:
  alertmanagers:
    - static_configs:
        - targets: ['localhost:9093']  # request to http://localhost:9093/api/v2/alerts
    - static_configs:
        - targets: ['localhost:5001']
          # - alertmanager: 9093


# Load rules once and periodically evaluate them according to the global 'evaluation_interval'.

rule_files:
  - "./rules/*.yml"  # 规则文件存储目录
  - "./rules/mysql/*.yml" # 其他目录下后缀为yml的规则文件
  # - "first_rules.yml"   # 指定文件名
  # - "second_rules.yml"


# A scrape configuration containing exactly one endpoint to scrape:
# Here it's Prometheus itself.
scrape_configs:
  # The job name is added as a label `job=<job_name>` to any timeseries scraped from this config.
  - job_name: "prometheus"
    # metrics_path defaults to '/metrics'
    # scheme defaults to 'http'.
    static_configs:
      - targets: ["localhost:9090"] # Prometheus自身默认的exporter服务地址

  - job_name: "linux_node_exporter" # node exporter自定义的名称
    static_configs:
      - targets: ["127.0.0.1:9100"] # node exporter的服务地址

  - job_name: "centos7_node_exporter" # 绑定一台机器上的多个node exporter
    static_configs:
      - targets: ["127.0.0.1:9200"]

  # - job_name: "centos7_node_exporter" # 错误用法 job_name必须唯一
  - job_name: "centos7_node_exporter2"
    static_configs:
      - targets: ["10.87.63.222:9200", "127.0.0.1:9300"]
        labels:
          node: 127.0.0.1 # 标签

  - job_name: "windows_exporter"
    static_configs:
      - targets: ["localhost:9182"]
配置参数
global:
scrape_interval(默认为1m)规则周期,从监控目标上收集信息。其中scrape_interval可以基于全局或基于单个metric定义;然后将监控信息持久存储在本地存储上。
scrape_configs:
- job_name 为Prometheus的job,job_name必填且唯一,一条规则能否对应多个监控对象。
配置完检查并重新加载配置文件
./promtool.exe check config prometheus.yml
不重启进程配置生效方式:
(1)对进程发送信号SIGHUP
(2)HTTP POST请求,需要开启--web.enable-lifecycle选项
curl -X POST http://localhost:9090/-/reload
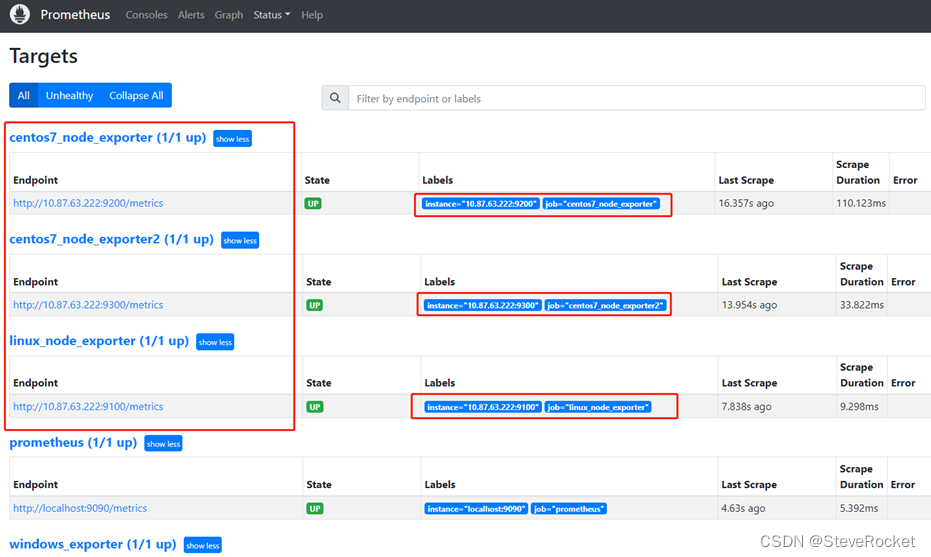
重启Prometheus服务后,在Targets页面能看到绑定的node即可
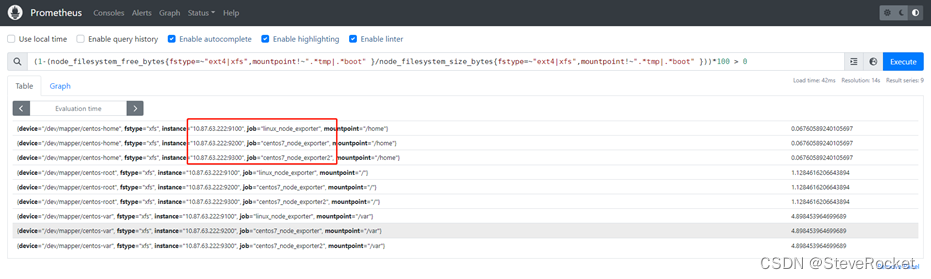
通过PromSQL查询语句查询是否有监控数据
Prometheus添加TLS加密认证
配置Prometheus 通过https加密,及使用账号密码才能登录
1. 新增 config.yml 文件,使用TLS及basic_auth
basic_auth_users:
admin: *********************
tls_server_config:
cert_file: node_exporter.crt
key_file: node_exporter.key
2. 修改prometheus.yml文件
# 将prometheus标签下加入认证,不然prometheus标签下的仍然是HTTP方式
- job_name: 'prometheus'
basic_auth:
username: admin
password: ******************
scheme: https
tls_config:
ca_file: node_exporter.crt
insecure_skip_verify: true
static_configs:
- targets: ['localhost:9090']
3. 修改启动服务脚本prometheus.service
# --web.config.file=config.yml
# ./prometheus --config.file=prometheus.yml --web.config.file=config.yml --web.listen-address=:9090 --web.enable-lifecycle
# 修改服务启动项
# vim /usr/lib/systemd/system/prometheus.service
[Unit]
Description=https://prometheus.io
[Service]
Restart=on-failure
ExecStart=/usr/local/prometheus/prometheus --config.file=/usr/local/prometheus/prometheus.yml --web.config.file=/usr/local/prometheus/config.yml --web.listen-address=:9090 --web.enable-lifecycle
[Install]
WantedBy=multi-user.target
重启Prometheus
# systemctl restart prometheus && systemctl status prometheus.service
使用特定URL和参数拉取配置示例:<scrape_config>的配置
参考:https://prometheus.io/docs/prometheus/latest/configuration/configuration/#scrape_config
prometheus从既有的web服务上拉取exporters信息,在web服务器上新增资源路径用于返回所需的exporters的信息。不过在配置prometheus的带params拉取的时候遇到一些问题,没有找到样例。
这块属于官网配置中的<scrape_config>的配置。scrape_config 主要指定目标和参数以描述如何抓取exporters上的信息,一般一份scrape的配置只用于一个任务,但在高级配置,也可以是多个。
目标可以在static_configs中静态的指定,也可以由动态服务发现机制来发现。同时还有 relabel_configs支持在抓取前,灵活地修改配置和标签。
# The job name assigned to scraped metrics by default.
#名称需要唯一
job_name: <job_name>
# How frequently to scrape targets from this job.
#指定抓取的间隔期,可以覆盖全局的配置
[ scrape_interval: <duration> | default = <global_config.scrape_interval> ]
# Per-scrape timeout when scraping this job.
#指定该任务每次抓取的超时时间
[ scrape_timeout: <duration> | default = <global_config.scrape_timeout> ]
# The HTTP resource path on which to fetch metrics from targets.
#指定http请求的资源路径
[ metrics_path: <path> | default = /metrics ]
# Configures the protocol scheme used for requests.
#配置是https或者http抓取
[ scheme: <scheme> | default = http ]
# Optional HTTP URL parameters.
#携带具体的参数
params:
[ <string>: [<string>, ...] ]
tls_config:
#使用https请求时,所使用的tls的配置
[ <tls_config> ]
以下为使用了上述各项配置的示例,从自有服务器上的特定路径,携带参数拉取exporters的信息
- job_name: 'exporters_test'
# metrics_path defaults to '/metrics'
# scheme defaults to 'http'.
metrics_path : '/path/to/resource'
params :
token: ['sdf1a5s1fs5a6sdf15d']
act: ['get_exporters']
hostdev: ['X1234567']
scheme: 'https'
tls_config:
insecure_skip_verify: true
static_configs:
- targets: ['111.111.111.111:10080']
以上参数均为示例。其中params中携带了3个参数token,act和hostdev。tls_config中的insecure_skip_verify:true表示不校验服务器端证书的合法性。针对更注重安全的场景,tls_config中可以参考官网的配置,配置CA证书,或者是本地证书。
# CA certificate to validate API server certificate with.
[ ca_file: <filename> ]
# Certificate and key files for client cert authentication to the server.
[ cert_file: <filename> ]
[ key_file: <filename> ]
# ServerName extension to indicate the name of the server.
# https://tools.ietf.org/html/rfc4366#section-3.1
[ server_name: <string> ]
# Disable validation of the server certificate.
[ insecure_skip_verify: <boolean> ]
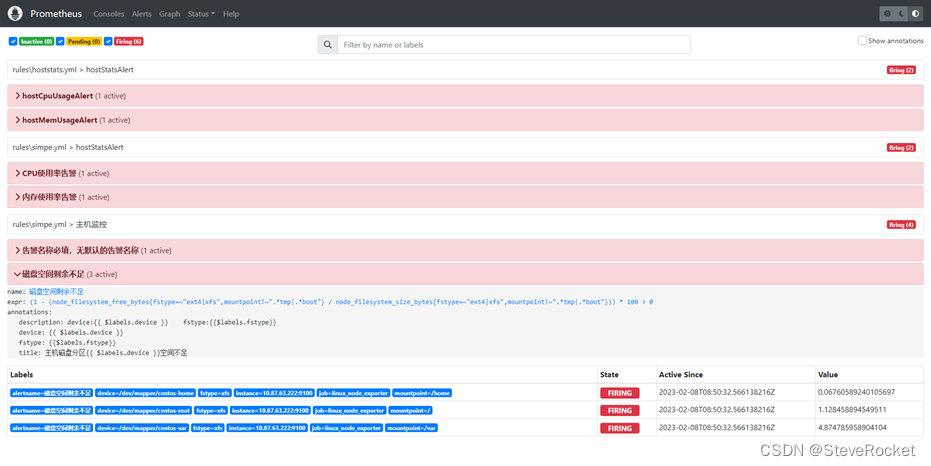
导航栏Alerts
该页面展示的是Prometheus所有的告警规则和告警信息,初始规则状态为active。
当一开始满足 expr表达式条件,且还没达到for指定条件时,就是 pending状态。
当达到expr表达式条件,且符合for指定的条件后,就是firing 状态。
inactive和pending状态的日志
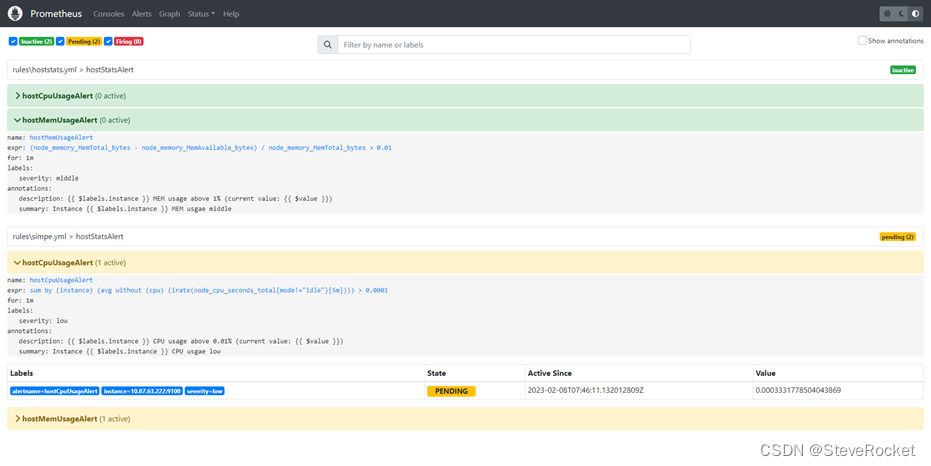
firing状态的日志

规则命中多个结果的 active
导航栏Graph
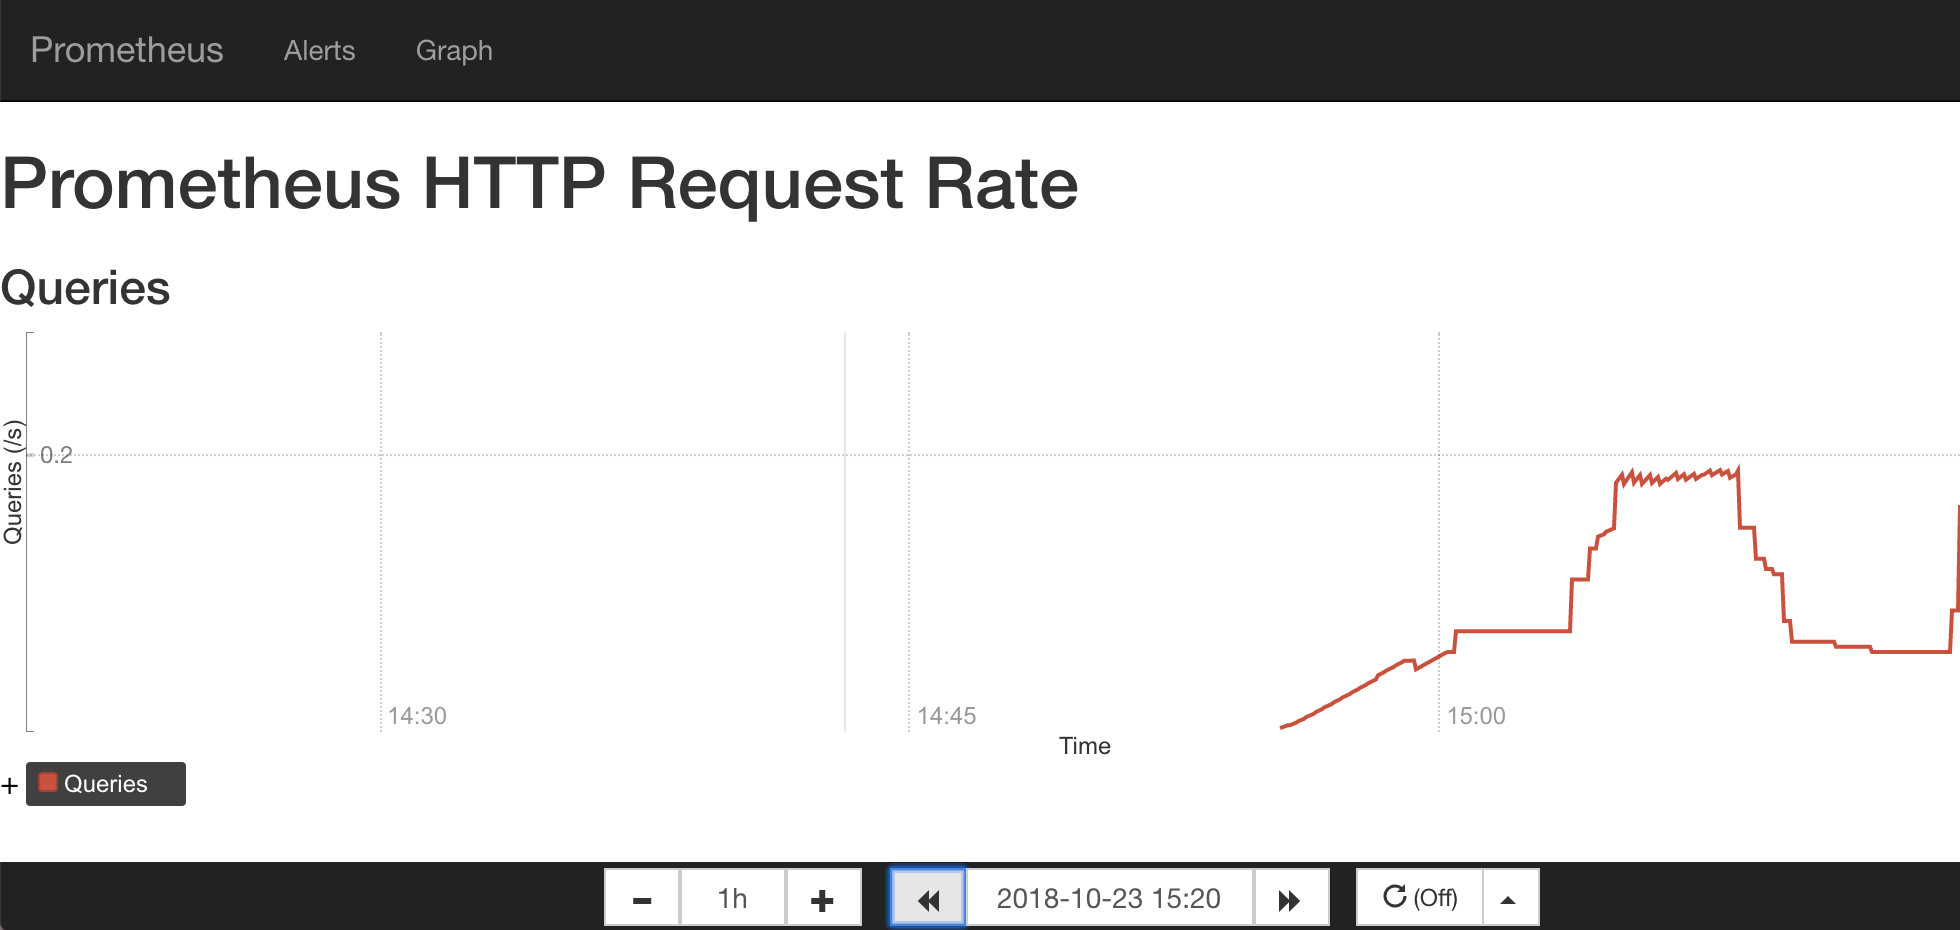
Prometheus UI是Prometheus内置的一个可视化管理界面,通过Prometheus UI能够轻松的了解Prometheus当前的配置,监控任务运行状态等。
通过Graph面板,还能直接使用PromQL实时查询监控数据:查询主机负载变化情况,可以使用关键字node_cpu_seconds_total可以查询出Prometheus采集到的主机负载的样本数据,这些样本数据按照时间先后顺序展示,形成了主机负载随时间变化的趋势图表:
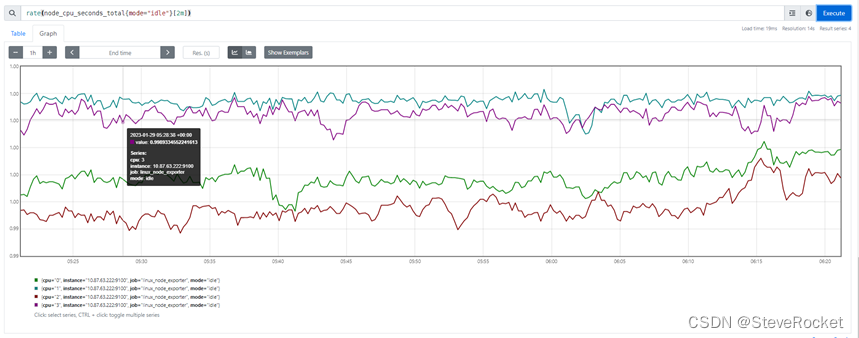
PromQL是Prometheus自定义的一套强大的数据查询语言,除了使用监控指标作为查询关键字以为,还内置了大量的函数,帮助用户进一步对时序数据进行处理。通过PromQL可以非常方便的对数据进行查询,过滤,以及聚合,计算等操作。
例如使用rate()函数,可以计算在单位时间内样本数据的变化情况即增长率,因此通过该函数可以近似的通过CPU使用时间计算CPU的利用率:
rate(node_cpu_seconds_total[2m])
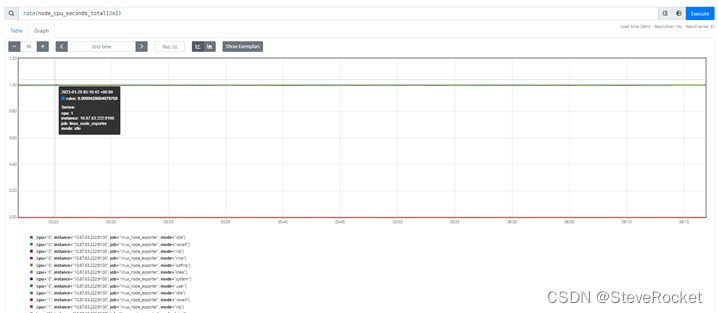
如果要忽略哪一个CPU,只需要使用without表达式,将标签CPU去除后聚合数据即可:
avg without(cpu) (rate(node_cpu_seconds_total[2m]))
如果需要计算系统CPU的总体使用率,通过排除系统闲置的CPU使用率即可:
1 - avg without(cpu) (rate(node_cpu_seconds_total{mode="idle"}[2m]))
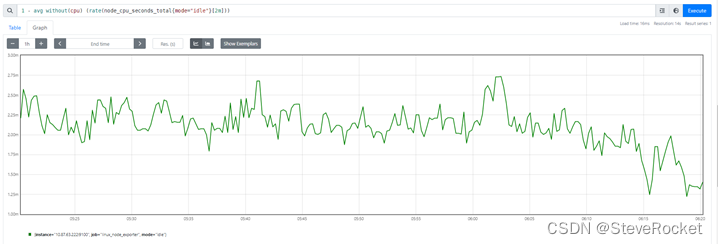
系统CPU使用率
导航栏Status

使用Console Template
Prometheus内置了一个简单的解决方案Console Template,允许用户通过Go模板语言创建任意的控制台界面,并且通过Prometheus Server对外提供访问路径。更好的监控平台使用参考下一篇:Grafana拖拽式创建可视化Dashboard监控平台
创建第一个Console Template页面。与Console Template有关的两个启动参数为--web.console.libraries和--web.console.templates,其分别指定页面组件以及页面的存储路径。默认情况下其分别指向Prometheus当前安装路径的console_libraries和consoles目录。
Prometheus在console_libraries目录中已经内置了一些基本的界面组件,用户可以直接使用。
在consoles目录下创建index.html文件后,刷新Prometheus界面可以看到在顶部菜单中多了一个Consoles菜单项,如下所示。该选项默认指向consoles/index.html文件:
启动参数
prometheus.exe --web.console.libraries="console_libraries" --web.console.templates="consoles"


需要注意的是,如果参数expr和name均是list类型,其必须是一一对应的。
除了直接使用PromConsole.Graph函数显示可视化图表以外,在Console Template中还可以使用模板组件prom_query_drilldown定义一个连接直接跳转到Graph页面,并显示相应表达式的查询结果,如下所示:
<h3>Links</h3>
{{ template "prom_query_drilldown" (args "prometheus_http_response_size_bytes_bucket") }}也可以和原生Prometheus UI一样定义一个时间轴控制器,方便用户按需查询数据:
加入这个时间轴控制器的方式也很简单,直接引用以下模板即可:
{{ template "prom_graph_timecontrol" . }}Prometheus运行参数详解
--version
显示应用的版本信息
配置文件参数
--config.file="prometheus.yml"
Prometheus配置文件路径
WEB服务参数
--web.listen-address="0.0.0.0:9090"
UI、API、遥测(telemetry)监听地址
--web.read-timeout=5m
读取请求和关闭空闲连接的最大超时时间
默认值:5m
--web.max-connections=512
最大同时连接数
默认值:512
--web.external-url=<URL>
可从外部访问普罗米修斯的URL
如果Prometheus存在反向代理时使用,用于生成相对或者绝对链接,返回到Prometheus本身,如果URL存在路径部分,它将用于给Prometheus服务的所有HTTP端点加前缀,如果省略,将自动派生相关的URL组件。
--web.route-prefix=<path>
Web端点的内部路由
默认路径:--web.external-url
--web.user-assets=<path>
静态资产目录的路径
在/user路径下生效可用
--web.enable-lifecycle
通过HTTP请求启用关闭(shutdown)和重载(reload)
启动添加了参数 --web.enable-lifecycle,让Prometheus支持通过web端点动态更新配置。然后终端执行如下POST请求
curl -X POST http://IP:port/-/reload
--web.enable-admin-api
启用管理员行为API端点
--web.console.templates="consoles"
总线模板目录路径
在/consoles路径下生效可用
--web.console.libraries="console_libraries"
总线库文件目录路径
--web.page-title="Prometheus Time Series Collection and Processing Server"
Prometheus实例的文档标题
--web.cors.origin=".*"
CORS来源的正则Regex,是完全锚定的
例如:'https?://(domain1|domain2).com'
数据存储参数
--storage.tsdb.path="data/"
指标存储的根路径
--storage.tsdb.retention=STORAGE.TSDB.RETENTION
[DEPRECATED]样例存储时间
此标签已经丢弃,用"storage.tsdb.retention.time"替代
--storage.tsdb.retention.time=STORAGE.TSDB.RETENTION.TIME
存储时长,如果此参数设置了,会覆盖"storage.tsdb.retention"参数;如果设置了"storage.tsdb.retention" 或者"storage.tsdb.retention.size"参数,存储时间默认是15d(天),单位:y, w, d, h, m, s, ms
--storage.tsdb.retention.size=STORAGE.TSDB.RETENTION.SIZE
[EXPERIMENTAL]试验性的。存储为块的最大字节数,需要使用一个单位,支持:B, KB, MB, GB,TB, PB, EB
此标签处于试验中,未来版本会改变
--storage.tsdb.no-lockfile
不在data目录下创建锁文件
--storage.tsdb.allow-overlapping-blocks
[EXPERIMENTAL]试验性的。允许重叠块,可以支持垂直压缩和垂直查询合并。
--storage.tsdb.wal-compression
压缩tsdb的WAL
WAL(Write-ahead logging, 预写日志),WAL被分割成默认大小为128M的文件段(segment),之前版本默认大小是256M,文件段以数字命名,长度为8位的整形。WAL的写入单位是页(page),每页的大小为32KB,所以每个段大小必须是页的大小的整数倍。如果WAL一次性写入的页数超过一个段的空闲页数,就会创建一个新的文件段来保存这些页,从而确保一次性写入的页不会跨段存储。
--storage.remote.flush-deadline=<duration>
关闭或者配置重载时刷新示例的等待时长
--storage.remote.read-sample-limit=5e7
在单个查询中通过远程读取接口返回的最大样本总数。0表示无限制。对于流式响应类型,将忽略此限制。
--storage.remote.read-concurrent-limit=10
最大并发远程读取调用数。0表示无限制。
--storage.remote.read-max-bytes-in-frame=1048576
在封送处理之前,用于流式传输远程读取响应类型的单个帧中的最大字节数。请注意,客户机可能对帧大小也有限制。
默认情况下,protobuf建议使用1MB。
告警规则参数
--rules.alert.for-outage-tolerance=1h
允许prometheus中断以恢复“for”警报状态的最长时间。
--rules.alert.for-grace-period=10m
警报和恢复的“for”状态之间的最短持续时间。这仅对配置的“for”时间大于宽限期的警报进行维护。
--rules.alert.resend-delay=1m
向Alertmanager重新发送警报之前等待的最短时间。
告警管理中心参数
--alertmanager.notification-queue-capacity=10000
挂起的Alertmanager通知的队列容量。
默认值:10000
--alertmanager.timeout=10s
发送告警到Alertmanager的超时时间
默认值:10s
数据查询参数
--query.lookback-delta=5m
通过表达式解析和联合检索指标的最大反馈时间
默认值:5m
--query.timeout=2m
查询中止前可能需要的最长时间。
默认值:2m
--query.max-concurrency=20
并发(concurrently)执行查询的最大值
--query.max-samples=50000000
单个查询可以加载到内存中的最大样本数。注意,如果查询试图将更多的样本加载到内存中,则会失败,因此这也限制了查询可以返回的样本数。
数量级:5千万
日志信息参数
--log.level=info
仅记录给定的日志级别及以上的信息
可选参数值:[debug, info, warn, error],其中之一
--log.format=logfmt
日志信息输出格式
可选参数值:[logfmt, json],其中之一
更多资料 · 微信公众号搜索【CTO Plus】关注后,获取更多,我们一起学习交流。
关于公众号的描述访问如下链接


 1554
1554


 被折叠的 条评论
为什么被折叠?
被折叠的 条评论
为什么被折叠?
 到【灌水乐园】发言


