


 本文记录了一次使用NCL在Linux环境中从前端到后端生成图片的过程。前端通过ExtJS发送POST请求,后端Java Struts接收并拼接NCL命令,执行ncl脚本生成nc文件的图像。通过Runtime执行shell命令,将输出重定向到日志文件,并处理进程输出流。最后,对生成的图片进行处理并以stream形式返回给前端展示。
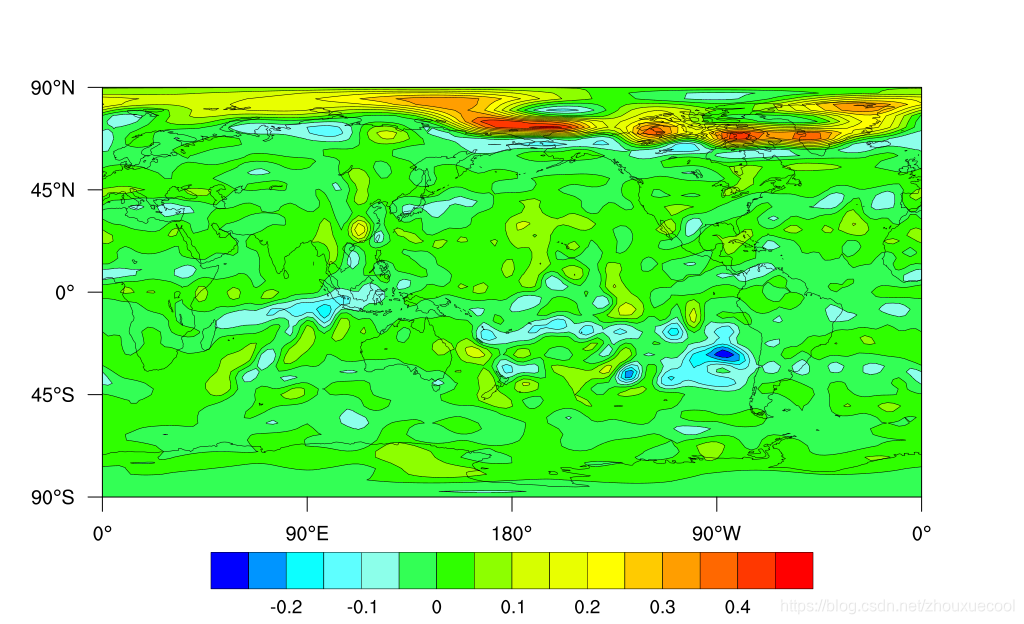
ncl出图大概长这样子:
数据文件:

ncl脚本:
![]()
;************************************************
;
; These files are loaded by default in NCL V6.2.0 and newer
; load "$NCARG_ROOT/lib/ncarg/nclscripts/csm/gsn_code.ncl"
; load "$NCARG_ROOT/lib/ncarg/nclscripts/csm/gsn_csm.ncl"
;
; @Author Zhou
; @Date 2016-07-25
;
;************************************************
begin

;************************************************
;try to read file name from command line parameter
;************************************************
if (.not. isvar("fileName")) then      ; is fileName on command line?
      fileName = "hgt.2000.nc,hgt.2003.nc";
end if

fileArray = str_split(fileName, ",");
print(fileArray);

if (.not. isvar("filePath")) then      ; is filePath on command line?
      filePath = "./";
end if

;************************************************
; for time dimesion
;************************************************
if (.not. isvar("timeDimension")) then      ; is timeDim command line?
      timeDimension = 0;
end if
if (.not. isvar("timeDimensionStep")) then      ; is timeDim command line?
      timeDimensionStep = 5;
end if

;if (.not. isvar("level")) then      ; is levelSpace command line?
;     level = 5;
;end if


;************************************************
; for spacing
;************************************************
if (.not. isvar("levelSpace")) then      ; is levelSpace command line?
      levelSpace = 5;
end if


;************************************************
; for display rectangle
;************************************************
if (.not. isvar("rectMinLat")) then      ; is rectMinLat command line?
      rectMinLat = -90;
end if
if (.not. isvar("rectMaxLat")) then      ; is rectMaxLat command line?
      rectMaxLat = 90;
end if
if (.not. isvar("rectMinLon")) then      ; is rectMinLon command line?
      rec
最低0.47元/天 解锁文章


 2027
2027

 被折叠的 条评论
为什么被折叠?
被折叠的 条评论
为什么被折叠?
 到【灌水乐园】发言


