一.柱状图宽背景实现
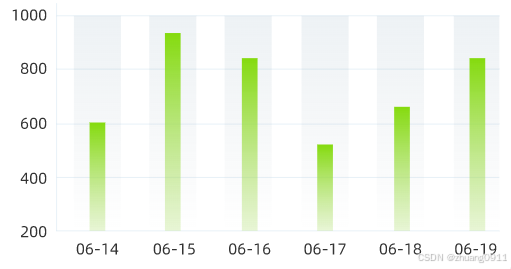
设计图
实现代码
const option = {
    title:{
      show: false,
    },
    legend:{
      show: false,
    },
    grid:{
      top: '30',
      left: '30',
      right: '30',
      bottom:'60'
    },
    xAxis: {
      type: 'category',
      data: xArr,
      axisLine:{
        show:false
      },
      axisTick:{
        show:false
      }
    },
    yAxis: {
      type: 'value',
      splitLine:{
        show: true,
        interval: 1
      }
    },
    series: [
      {
        name: t('Message.ProductQuantity'),
        data: yArr.ProductQuantityArr,
        type: 'bar',
        barWidth: 10,//柱状宽度
        z: 2,
        showBackground: true,
        backgroundStyle: {
          color: {
            type: 'linear',
            x: 10,
            y: 0,
            x2: 10,
            y2: 0,
            colorStops: [{
                offset: 0, color: '#52809E'// 0% 处的颜色
            }, {
                offset: 1, color:  'rgba(62, 92, 111, 0.1)' // 100% 处的颜色
            }],
            global: false // 缺省为 false
          },
          borderColor: {
            type: 'linear',
            x: 0,
            y: 0,
            x2: 0,
            y2: 1,
            colorStops: [{
                offset: 0, color: '#52809E'// 0% 处的颜色
            }, {
                offset: 1, color:  'rgba(62, 92, 111, 0.1)' // 100% 处的颜色
            }],
            global: false // 缺省为 false
          },
          borderWidth: 20,
          opacity: '0.1'
        },
        itemStyle:{
          zIndex: 2,
          color:new echarts.graphic.LinearGradient(0, 0, 1, 1, [
            {
              offset: 0,
              color: '#84DB0E'
            },
            {
              offset: 1,
              color: 'rgba(178, 223, 116, 0.3)'
            }
          ])
        }
      },
    ]
  };
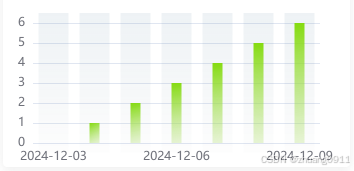
效果图


 7672
7672

 被折叠的 条评论
为什么被折叠?
被折叠的 条评论
为什么被折叠?
 到【灌水乐园】发言


