


前言
虽然挺简单的,但还是纪念一下第一个,也应该是最后一个用cocos开发的游戏
注意事项
- 需要多组数据可以参考: https://www.jb51.net/article/209761.htm
- 不明原因导致第一次改变值不会触发过渡效果
最终效果
步骤
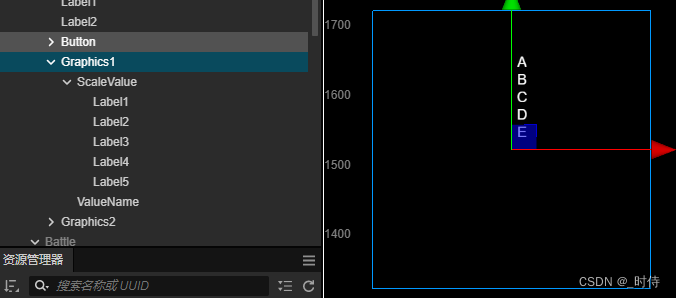
节点结构
挂载脚本
注释都挺清晰,感觉无需多余的解释
import { _decorator, Color, Component, EventTouch, Graphics, Label, Node, tween, UITransform, v2, v3, Vec2 } from 'cc'
import NetworkManager from '../global/NetworkManager'
import { createUINode, isEmpty } from '../utils'
import DataManager from '../global/DataManager'
import EventManager from '../global/EventManager'
import { EventEnum } from '../enum'
import { IActor, ISkill } from '../common'
const { ccclass, property } = _decorator

/**
 * 雷达图数据
 */
export interface RadarChartData {
  /** 数值 */
  values: string[]

  /** 线的宽度 */
  lineWidth?: number

  /** 线的颜色 */
  lineColor?: Color

  /** 填充的颜色 */
  fillColor?: Color
}

const radius = 150
const scale = 6 //刻度数
const axes = 6 //轴线数
const duration = 0.1

const defaultOptions = {
  lineWidth: 5,
  lineColor: new Color(255, 255, 255, 255),
  fillColor: new Color(222, 226, 230, 150),
}

// 参考 https://www.jb51.net/article/209761.htm
@ccclass('RadarChart')
export class RadarChart extends Component {
  graphics: Graphics
  angles: number[] = []
  valueItems: Label[] = []

  data: RadarChartData
  keepUpdating: boolean = false
  coords: Vec2[] = []
  currentCoords: Vec2[] = []

  protected onDestroy(): void {
    EventManager.Instance.off(EventEnum.renderChart, this.renderChart, this)
  }

  protected onLoad(): void {
    EventManager.Instance.on(EventEnum.renderChart, this.renderChart, this)
  }

  protected start(): void {
    this.graphics = this.node.getComponent(Graphics)

    this.currentCoords = new Array(axes).fill(v2(0, 0))

    this.angles = []
    // 轴间夹角
    const iAngle = 360 / axes
    for (let i = 0; i < axes; i++) {
      // 计算
      const angle = iAngle * i + 90
      this.angles.push(angle)
    }

    // 非绘制部分
    const texts = ['破坏力', '成长性', '精密度', '持久力', '射程', '速度']
    const valueName = this.node.getChildByName('ValueName')
    for (let j = 0; j < this.angles.length; j++) {
      let angle = this.angles[j]
      const radian = (Math.PI / 180) * angle
      // 设置文本位置在圆的外围,稍微远一点
      const textPos = v3((radius + 40) * Math.cos(radian), (radius + 40) * Math.sin(radian))

      const valueNameItem = createUINode()
      valueNameItem.setPosition(textPos)
      valueNameItem.setParent(valueName)
      const label = valueNameItem.addComponent(Label)
      label.string = texts[j]
      label.fontSize = 20
      label.lineHeight = 20
      label.useSystemFont = false

      label.font = DataManager.Instance.fontFamily

      // 旋转文本使其朝向圆心
      angle -= 90
      if (j >= 2 && j <= 4) {
        angle += 180
      }
      valueNameItem.angle = angle
    }

    this.drawBase()

    // 破坏力 成长性 精密度 持久力 射程 速度
    // this.draw({ values: ['E', 'E', 'E', 'E', 'E', 'E'] })
  }

  protected update(dt: number): void {
    if (!this.keepUpdating) return
    // 绘制当前数据
    this.draw(this.data)
  }

  renderChart(actor: IActor, target: string) {
    // 取'Graphics1'为玩家
    if (target === this.node.name) {
      let attack = 0
      let grow = 0 //成长性 受持续能力、特殊能力影响
      let precision = 0 //精密度  受穿刺攻击、多范围攻击、破甲影响
      let defense = 0 //持久力  受防御力影响
      let range = 0 //射程  远程攻击数量
      let speed = 0 //速度  受闪避技能影响
      Object.keys(actor.skills).forEach((key) => {
        actor.skills[key].forEach((skill: ISkill) => {
          if (isEmpty(skill)) return
          if (skill.type.indexOf(4) !== -1) {
            grow++
            if (skill.defense) defense += skill.defense * 2 //持久力相当于加三遍
            if (skill.damage) attack += skill.damage * 2 //持久力相当于加三遍
            if (skill.pierce) precision += skill.damage * 2
            if (skill.broken) precision += skill.broken * 2
          } else if (skill.type.indexOf(5) !== -1) {
            grow++
          }

          if (skill.type.indexOf(3) !== -1) {
            speed++
          } else {
            if (skill.location) {
              if (skill.location != '0') speed++
            }
          }

          if (skill.defense) defense += skill.defense
          if (skill.damage) attack += skill.damage
          if (skill.longrang) range += 1

          if (skill.range) {
            skill.range.forEach((r) => {
              if (r.length > 1) precision += r.length - 1
            })
            if (skill.range.length >= 2) precision += skill.range.length - 1
          }
          if (skill.pierce) precision += skill.damage
          if (skill.broken) precision += skill.broken
        })
      })

      const max = {
        attack: 50,
        grow: 12,
        precision: 18,
        defense: 18,
        range: 7,
        speed: 6,
      }
      function getRating(value, maxValue) {
        const rate = value / maxValue
        if (rate >= 0.9) return 'S'
        if (rate >= 0.7) return 'A'
        if (rate >= 0.5) return 'B'
        if (rate >= 0.3) return 'C'
        if (rate >= 0.1) return 'D'
        return 'E'
      }
      // 根据比例计算所处等级
      const values = [
        getRating(attack, max.attack),
        getRating(grow, max.grow),
        getRating(precision, max.precision),
        getRating(defense, max.defense),
        getRating(range, max.range),
        getRating(speed, max.speed),
      ]

      // 计算节点坐标
      this.setValues(values)
      this.data = { values }

      //   过渡效果  --未解之谜,第一次改变没有过渡
      // 处理重复调用
      this.unscheduleAllCallbacks()
      // 打开每帧更新
      this.keepUpdating = true
      //   获取目标值
      for (let j = 0; j < axes; j++) {
        //   设置值
        const valueMap = { E: 1 / 6, D: 2 / 6, C: 3 / 6, B: 4 / 6, A: 5 / 6, S: 1 }
        let value = valueMap[values[j]]

        const length = value * radius
        const radian = (Math.PI / 180) * this.angles[j]
        const pos = v2(length * Math.cos(radian), length * Math.sin(radian))
        // this.coords.push(pos)

        tween(this.currentCoords)
          .to(duration, { [j]: v2(0, 0) })
          .to(duration, { [j]: pos })
          .start()
        // .sequence(tween().to(duration, { [j]: v2(0, 0) }), tween().to(duration, { [j]: pos }))
      }
      this.scheduleOnce(() => {
        // 关闭每帧更新
        this.keepUpdating = false
      }, duration * 2 + 0.5) // 太短了一开始不更新

      //   this.draw({ values })
    }
  }

// 绘制图表
  drawBase() {
    // 创建一个二维数组  保存每圈每个点的坐标
    let scalesSet: Vec2[][] = []
    for (let i = 0; i < scale; i++) {
      // 用来保存当前层上的刻度坐标
      let scales = []
      // 计算刻度在轴上的位置  轴线长度 - (轴线长度 / 轴上刻度个数) * i
      const length = radius - (radius / scale) * i
      for (let j = 0; j < this.angles.length; j++) {
        // 将角度转为弧度
        const radian = (Math.PI / 180) * this.angles[j]
        // 根据三角公式计算刻度相对于中心点(0, 0)的坐标
        const pos = v2(length * Math.cos(radian), length * Math.sin(radian))
        // 推进数组
        scales.push(pos)
      }
      // 推进二维数组
      scalesSet.push(scales)
    }

    this.graphics.strokeColor = defaultOptions.lineColor
    this.graphics.fillColor = defaultOptions.fillColor
    this.graphics.lineWidth = defaultOptions.lineWidth

    this.graphics.circle(0, 0, radius)

    // 绘制轴线
    // 遍历全部最外层的刻度
    for (let i = 0; i < scalesSet[0].length; i++) {
      // 画笔移动至中心点
      this.graphics.moveTo(0, 0)
      // 创建线条
      this.graphics.lineTo(scalesSet[0][i].x, scalesSet[0][i].y)
    }

    //   刻度
    for (let i = 0; i < scalesSet.length; i++) {
      for (let j = 0; j < scalesSet.length; j++) {
        const angle = this.angles[j] - 90 // 使刻度垂直于轴线
        const pos = scalesSet[j]
        // 计算刻度的两个端点
        const x1 = pos[i].x + Math.cos((angle * Math.PI) / 180) * 5
        const y1 = pos[i].y + Math.sin((angle * Math.PI) / 180) * 5
        const x2 = pos[i].x - Math.cos((angle * Math.PI) / 180) * 5
        const y2 = pos[i].y - Math.sin((angle * Math.PI) / 180) * 5
        // 绘制刻度
        this.graphics.moveTo(x1, y1)
        this.graphics.lineTo(x2, y2)
      }
    }

    this.graphics.stroke()

    // 绘制外圈
    const count = 24 // 刻度数量
    const innerRadius = radius + 60 // 内圆半径
    const outerRadius = radius + 70 // 外圆半径
    this.graphics.circle(0, 0, innerRadius)
    this.graphics.circle(0, 0, outerRadius)
    this.graphics.stroke()

    // 画刻度
    this.graphics.lineWidth = 10
    for (let i = 0; i < count; i++) {
      const angle = (i * Math.PI * 2) / count
      const x1 = Math.cos(angle) * innerRadius
      const y1 = Math.sin(angle) * innerRadius
      const x2 = Math.cos(angle) * outerRadius
      const y2 = Math.sin(angle) * outerRadius

      this.graphics.moveTo(x1, y1)
      this.graphics.lineTo(x2, y2)
    }

    this.graphics.stroke()
  }

  /**
   * 绘制数据
   * @param data 数据
   */
  public draw(data: RadarChartData) {
    this.graphics.clear()
    this.drawBase()
    // 处理数据
    // const datas = Array.isArray(data) ? data : [data]

    // 开始绘制数据
    // 装填染料
    this.graphics.strokeColor = data.lineColor || defaultOptions.lineColor
    this.graphics.fillColor = data.fillColor || defaultOptions.fillColor
    this.graphics.lineWidth = data.lineWidth || defaultOptions.lineWidth

    // 创建线条
    this.graphics.moveTo(this.currentCoords[0].x, this.currentCoords[0].y)
    for (let j = 1; j < this.currentCoords.length; j++) {
      this.graphics.lineTo(this.currentCoords[j].x, this.currentCoords[j].y)
    }
    this.graphics.close() // 闭合线条

    // 填充包围区域
    this.graphics.fill()
    // 绘制线条
    this.graphics.stroke()
  }

  setValues(values: string[]) {
    const valueName = this.node.getChildByName('ValueName')

    // 已经存在的Label,直接修改
    if (this.valueItems.length > 0) {
      for (let j = 0; j < this.angles.length; j++) {
        this.valueItems[j].string = values[j]
      }
      return
    }

    for (let j = 0; j < this.angles.length; j++) {
      const angle = this.angles[j]
      const radian = (Math.PI / 180) * angle
      // 设置文本位置在圆的外围,稍微远一点
      const textPos = v3((radius + 20) * Math.cos(radian), (radius + 20) * Math.sin(radian))

      // 新建Label
      let valueNameItem = createUINode()
      valueNameItem.setPosition(textPos)
      valueNameItem.setParent(valueName)
      const label = valueNameItem.addComponent(Label)
      label.fontSize = 20
      label.lineHeight = 20
      this.valueItems.push(label)

      label.string = values[j] // 设置文本
    }
  }
}


 被折叠的 条评论
为什么被折叠?
被折叠的 条评论
为什么被折叠?
 到【灌水乐园】发言


