


Python——可视化神器pyecharts的正确打开方式
回家路上,无意中翻到了“python与算法社区”公众号中的一篇文章《pyecharts绘制出的4类惊艳动图》,发现挺有意思。回家尝试了下,效果不错。也踩了一些坑,于是整理下,便于提升自己工作中的图表可视化能力(重点可用于PPT、周报、年终总结报告中)。
如果有幸能帮到你,点个赞吧,码字不易。
1、Echarts的背景
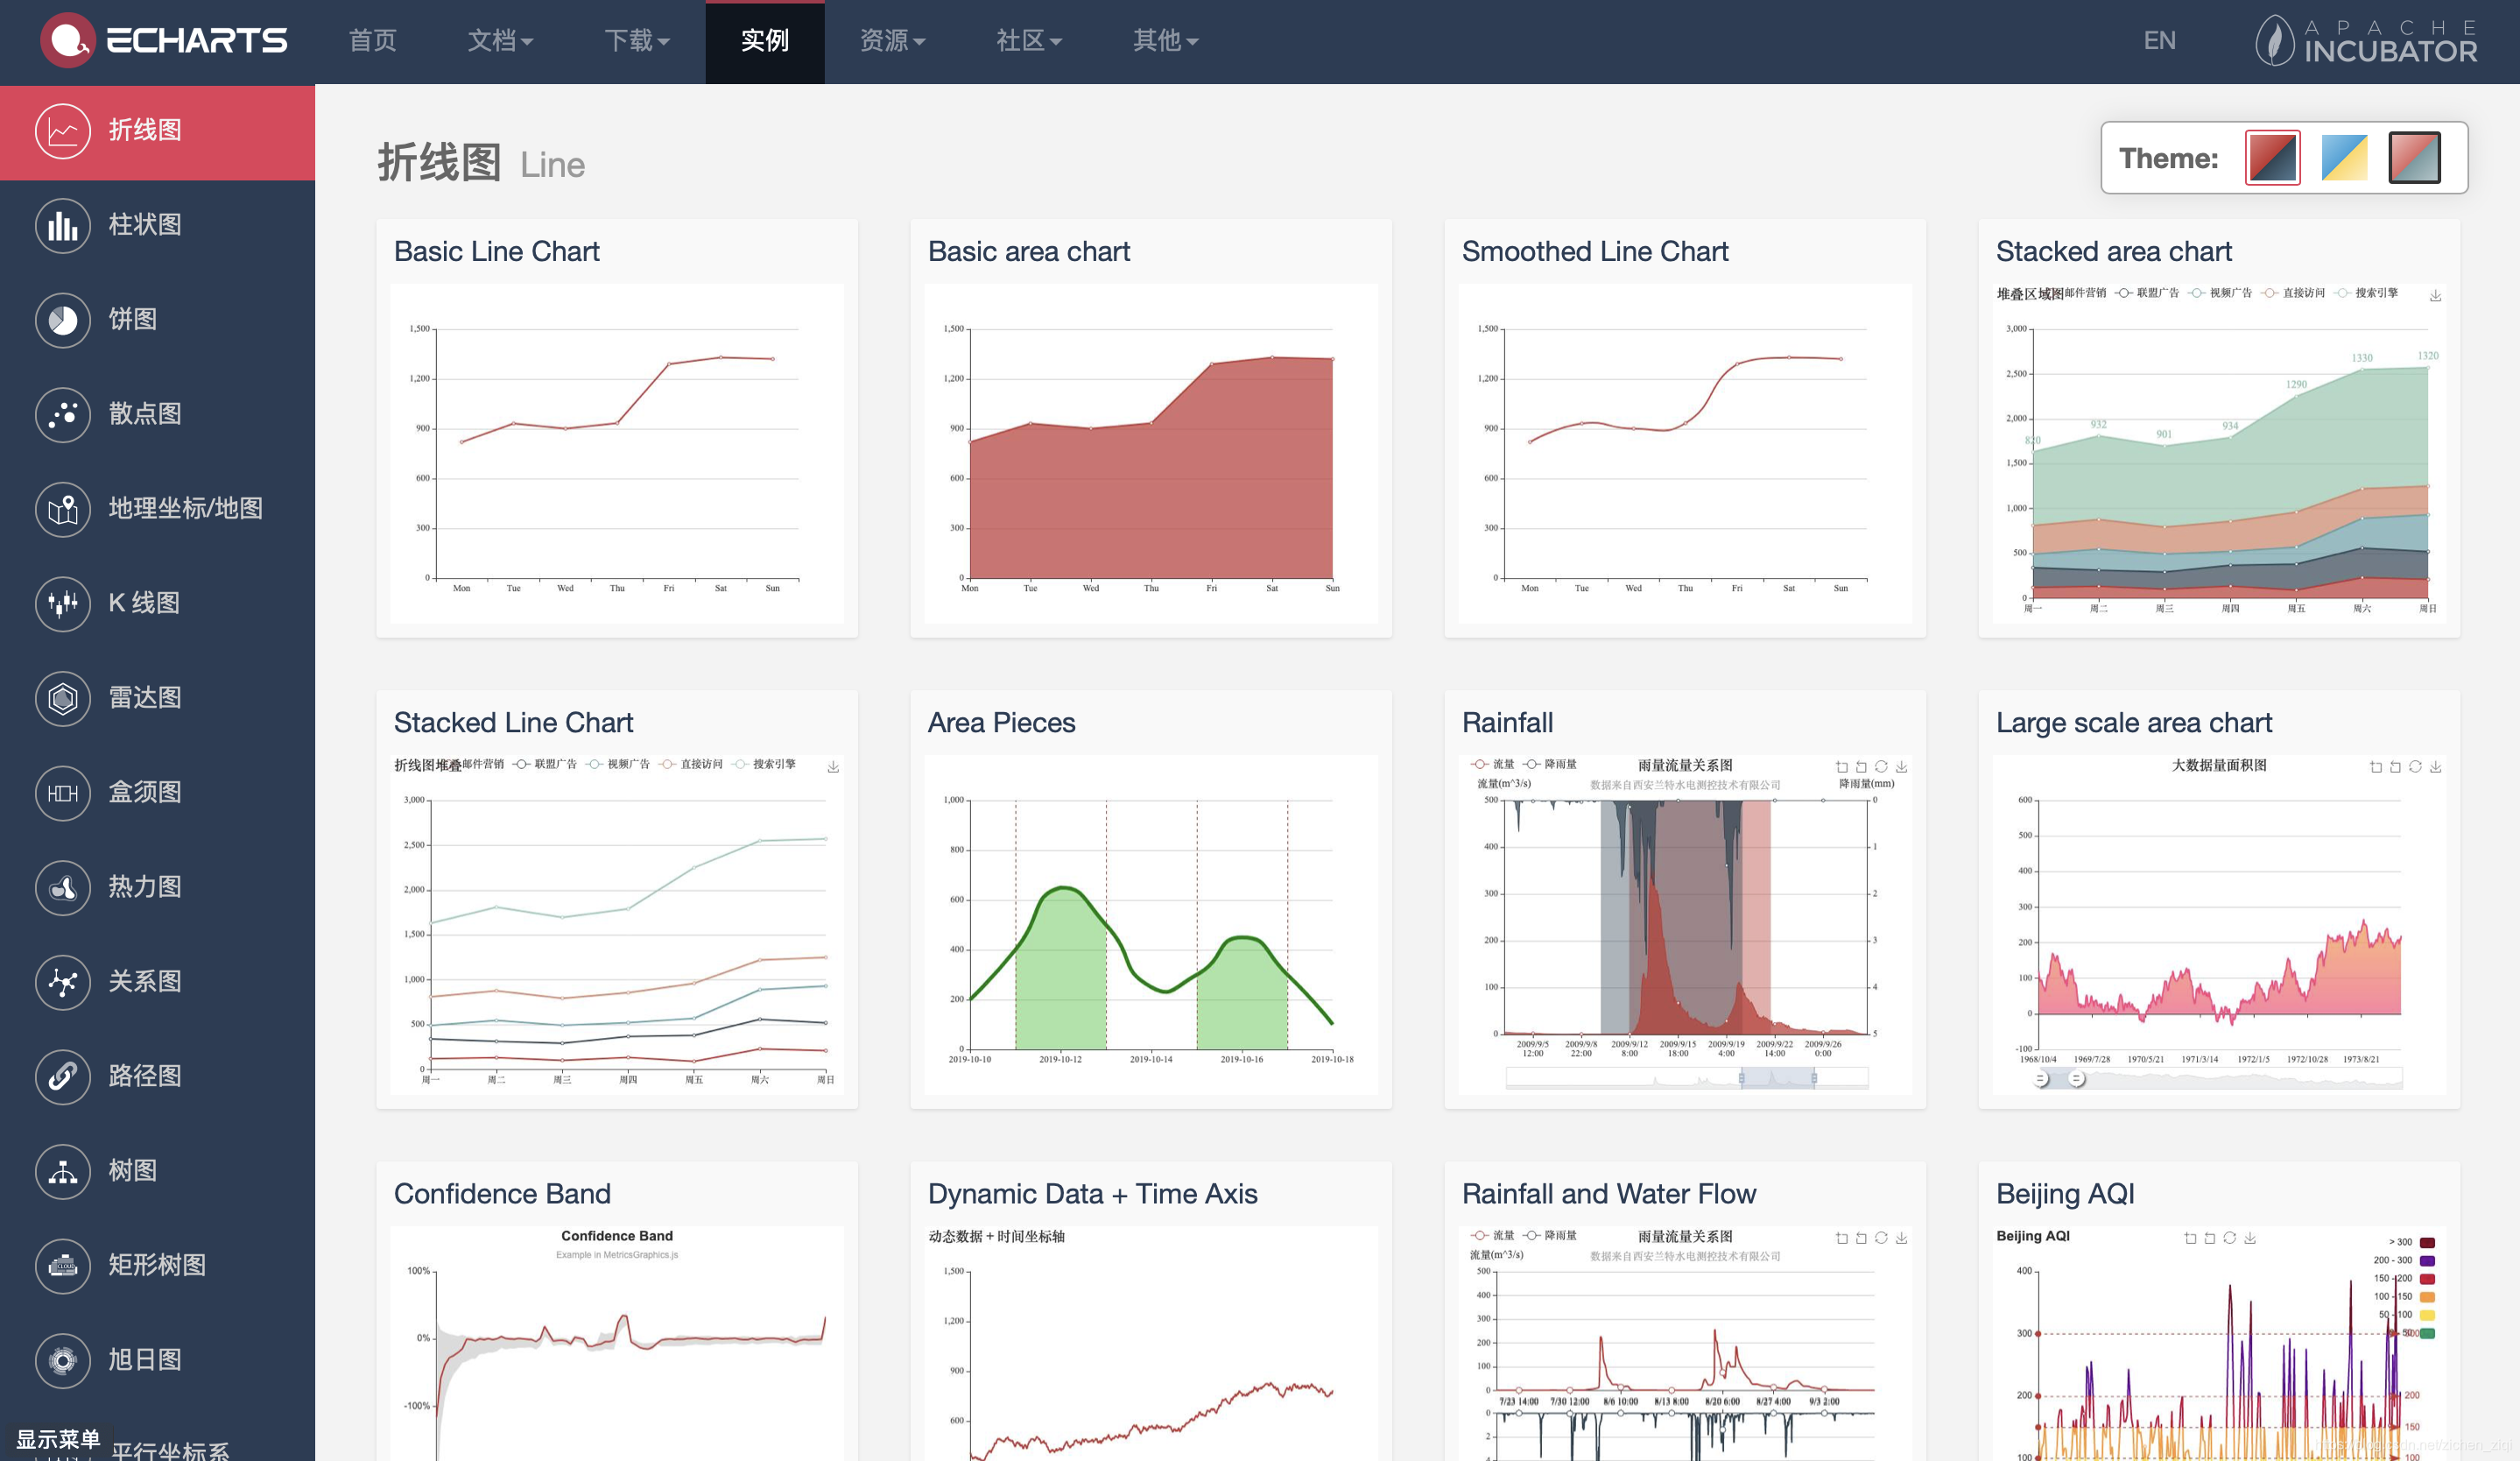
Echarts 是一个由百度开源的数据可视化工具,凭借着良好的交互性与精巧的图表设计,得到了众多开发者的认可。 Python 是一门富有表达力的语言,很适合用于数据处理。当数据分析遇上数据可视化时,pyecharts 就诞生了。目前,Echarts已支持:
- 图表:30多种图表
- 地图:300多个中国城市/ 200多个国家和地区
- 平台:Pure Python / Jupyter Notebook / Web框架
下面是Echarts的几个官网。
- pyecharts的Github:https://github.com/pyecharts/pyecharts/(包含安装方法、简介与部分demo)
- pyecharts的Demo:https://github.com/pyecharts/pyecharts-gallery(Python Echarts绘图库,30+种图表)
- ECHARTS官网:https://echarts.apache.org/examples/zh/#chart-type-scatter(可视化JS工具)
其他关于pyecharts的博客,可以参考:
注意:网上代码很多,有的代码跑不起是因为pyecharts版本存在差异。
2、安装
以mac系统为例介绍,pyecharts的正确打开姿势。
pip install -i https://pypi.tuna.tsinghua.edu.cn/simple pyecharts安装后,确认版本是1.8.1。:
Installing collected packages: pyecharts
Successfully installed pyecharts-1.8.1
3、demo
pyecharts支持两种方式生成图像:生成html与直接生成图像。
(1)生成html,再用浏览器打开
import datetime
import random
from pyecharts import options as opts
from pyecharts.charts import Calendar
begin = datetime.date(2017, 1, 1)
end = datetime.date(2017, 12, 31)
data = [
[str(begin + datetime.timedelta(days=i)), random.randint(1000, 25000)]
for i in range((end - begin).days + 1)
]
c = (
Calendar()
.add("", data, calendar_opts=opts.CalendarOpts(range_="2017"))
.set_global_opts(
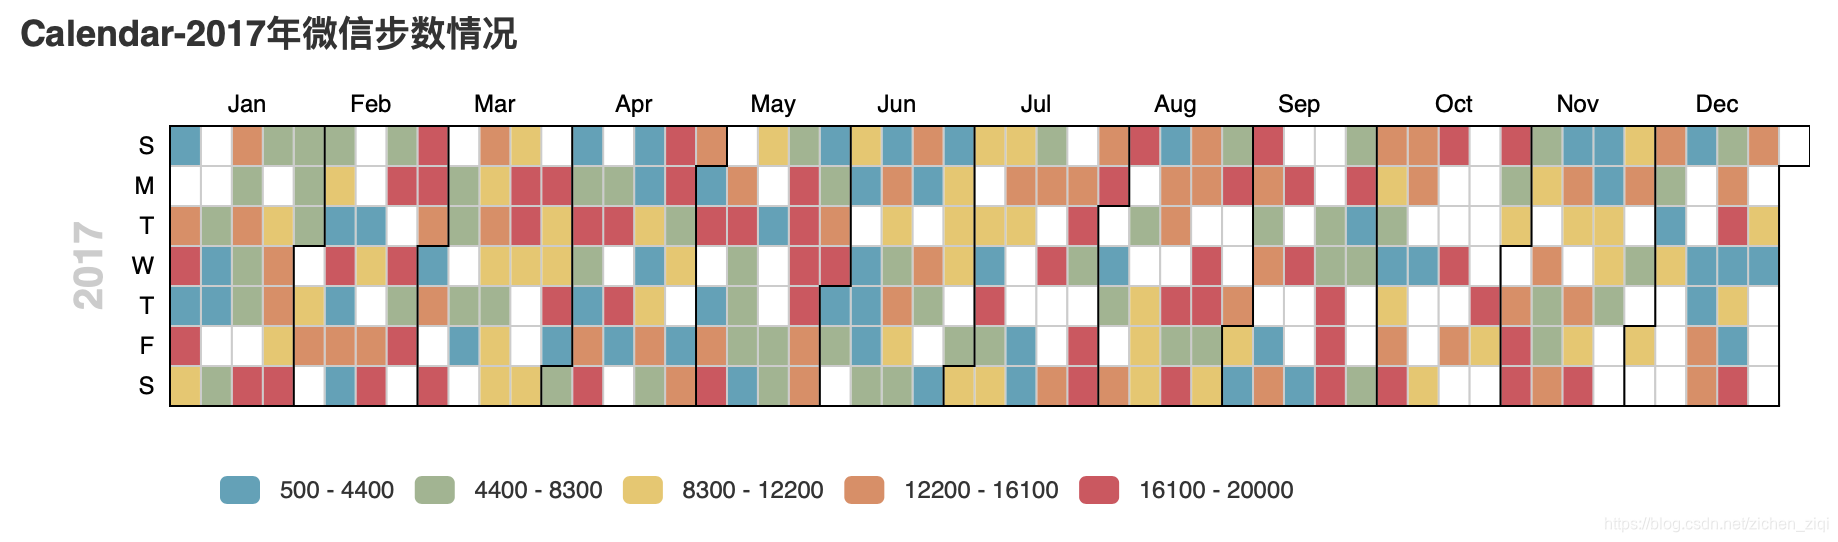
title_opts=opts.TitleOpts(title="Calendar-2017年微信步数情况"),
visualmap_opts=opts.VisualMapOpts(
max_=20000,
min_=500,
orient="horizontal",
is_piecewise=True,
pos_top="230px",
pos_left="100px",
),
)
.render("calendar_base.html")
)运行后,得到一个“calendar_base.html”文件,然后用浏览器打开,便可以得到:
(2)直接生成图像,示例如下:
from snapshot_selenium import snapshot as driver
from pyecharts import options as opts
from pyecharts.charts import Bar
from pyecharts.render import make_snapshot
def bar_chart() -> Bar:
c = (
Bar()
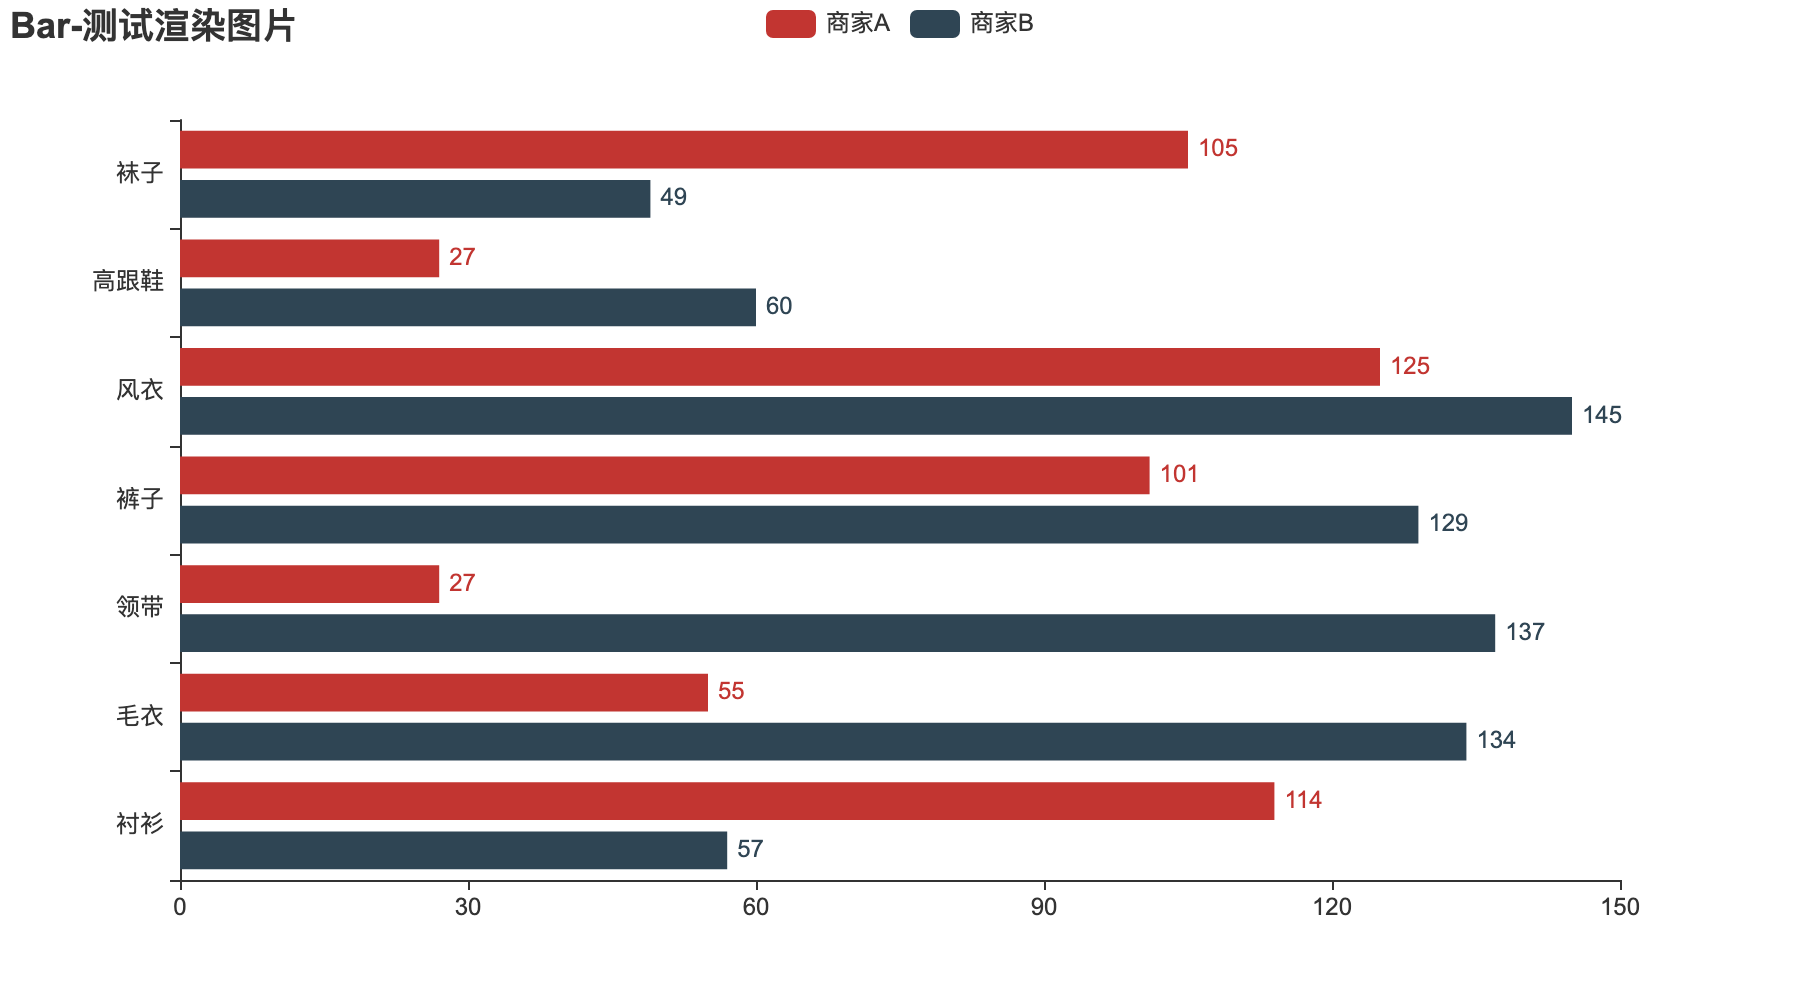
.add_xaxis(["衬衫", "毛衣", "领带", "裤子", "风衣", "高跟鞋", "袜子"])
.add_yaxis("商家A", [114, 55, 27, 101, 125, 27, 105])
.add_yaxis("商家B", [57, 134, 137, 129, 145, 60, 49])
.reversal_axis()
.set_series_opts(label_opts=opts.LabelOpts(position="right"))
.set_global_opts(title_opts=opts.TitleOpts(title="Bar-测试渲染图片"))
)
return c
# 需要安装 snapshot-selenium 或者 snapshot-phantomjs
make_snapshot(driver, bar_chart().render(), "bar.png")运行后,会得到一个"bar.png"图片:
如果直接运行,报错了,请耐心地往下面看。直接生成图像的demo,需要安装snapshot-selenium 或者 snapshot-phantomjs。本文安装的snapshot-selenium。
pip install -i https://pypi.tuna.tsinghua.edu.cn/simple snapshot_selenium如果再运行,报了下面的错误,就得再辛苦一下咯。
selenium.common.exceptions.WebDriverException: Message: 'chromedriver'
解决方案简化如下。(参考Mac安装Chromedriver,命令行brew install chromedriver不得行,不用再去踩坑!!!)
- A. 打开谷歌浏览器,在地址栏输入
chrome://version/查看到浏览器当前版本号,如我的mac电脑上谷歌浏览器版本是:
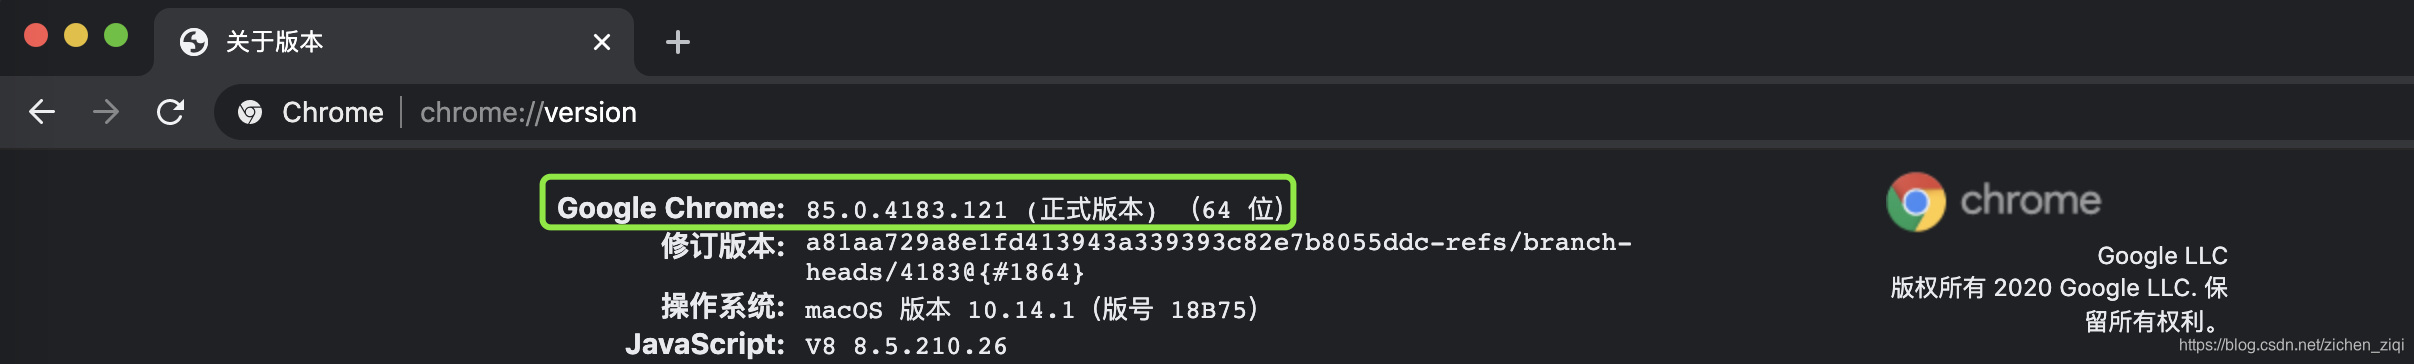
- B. 打开谷歌浏览器驱动的下载网址:http://chromedriver.storage.googleapis.com/index.html,下载85.0.4183版本
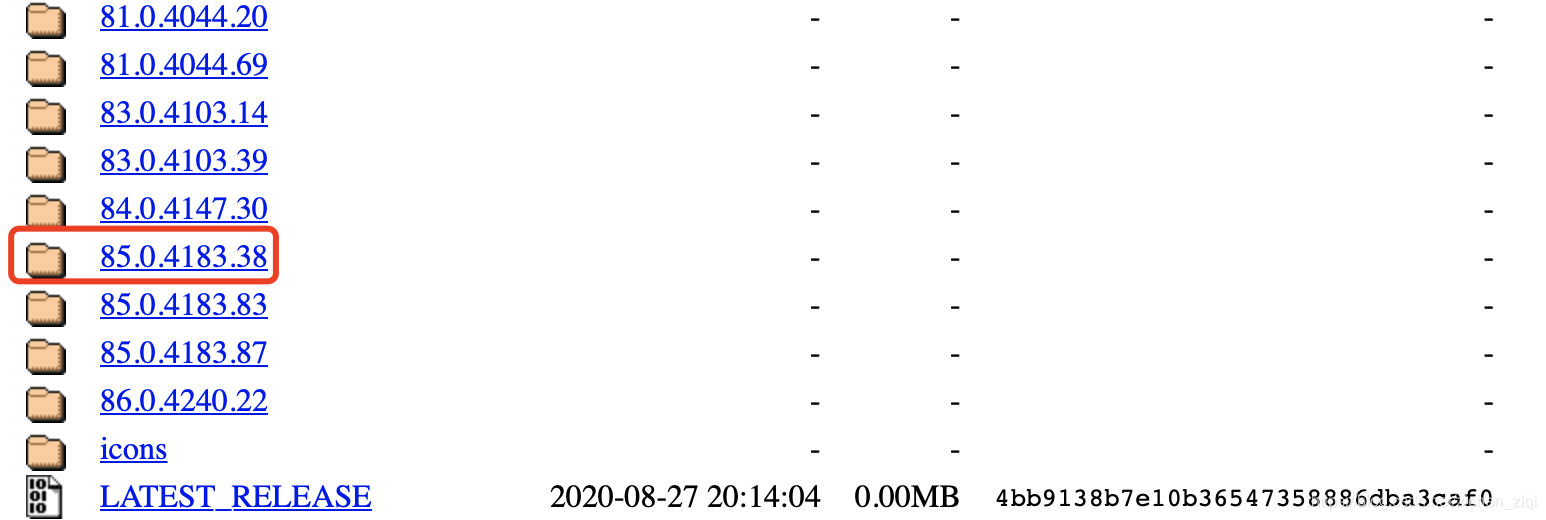
- C. 选择对应的系统,下载完后,解压打开,得到一个可执行文件:chromedriver.exe
c1. 如果是Windows系统,把它放到下面两个路径下(":\Program Files (x86)\Google\Chrome\Application" 与python安装的目录下)
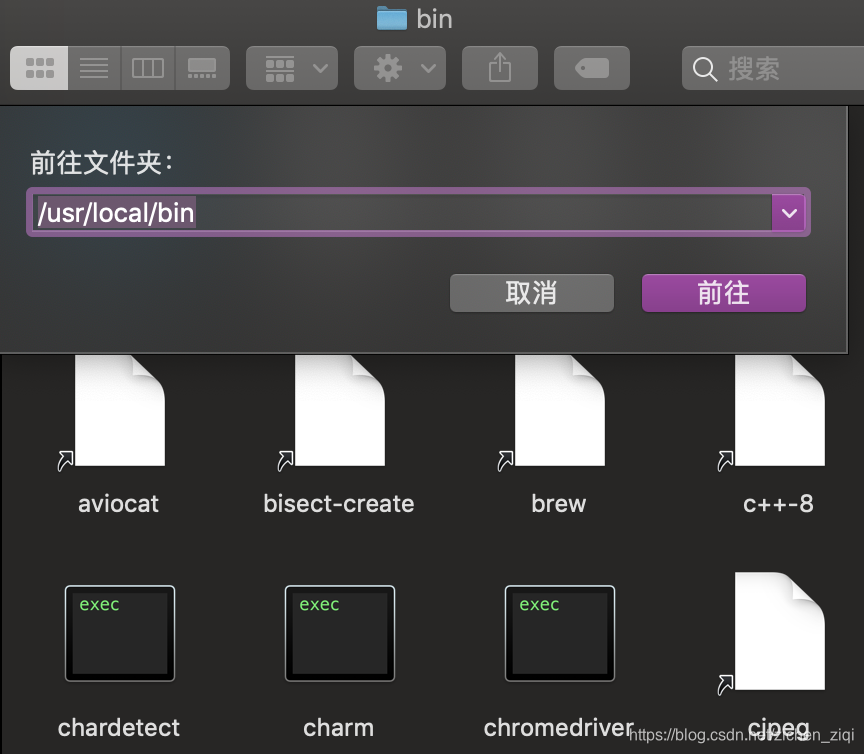
c2. 如果是Mac系统,把它放在"/usr/local/bin"下
- D. 再次点击运行,就可以正常出结果了。


 1万+
1万+

 被折叠的 条评论
为什么被折叠?
被折叠的 条评论
为什么被折叠?
 到【灌水乐园】发言


