


bounds1 = [0,2,4,6,10,20,30]
c1 = ax1.contourf(lon_da, lat_da, rms_clim_pre*100,levels=bounds1,zorder=0,extend='both',transform=ccrs.PlateCarree(),cmap=plt.cm.Reds)

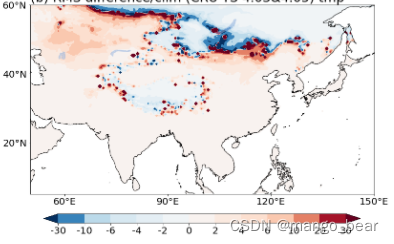
bounds2 = [-30,-10,-6,-4,-2,0,2,4,6,10,20,30]
#使得colorbar从0开始不同
from matplotlib.colors import BoundaryNorm
cmap = plt.get_cmap('RdBu_r')
norm = BoundaryNorm(bounds2,ncolors=cmap.N,clip=True)
c2 = ax2.contourf(lon_da, lat_da, rms_clim_tmp*100, levels=bounds2,zorder=0,extend='both',transform=ccrs.PlateCarree(),cmap=cmap)


 503
503


 被折叠的 条评论
为什么被折叠?
被折叠的 条评论
为什么被折叠?
 到【灌水乐园】发言


