


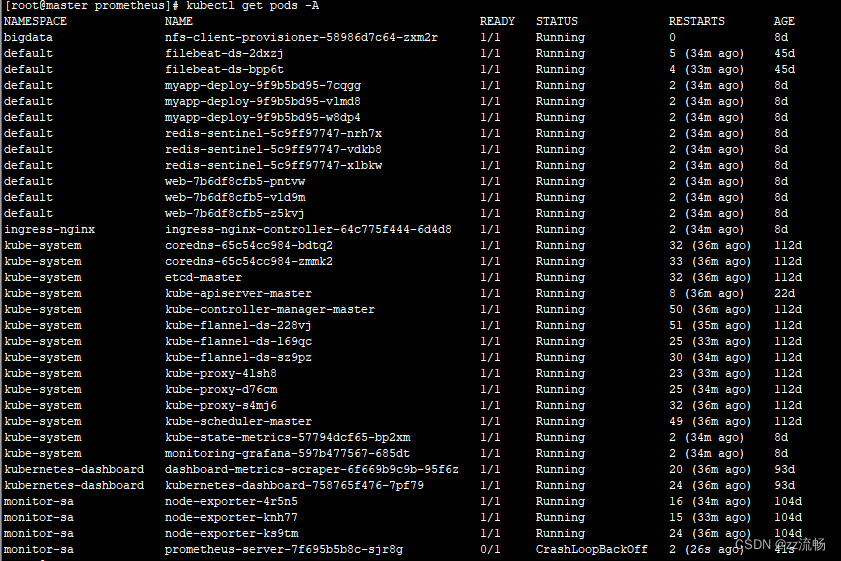
今天登录了k8s测试环境准备安装个东西,发下prometheus有个服务没起来,截图如下
首先使用kubectl describe查看容器状态:
kubectl describe pod prometheus-server-7f695b5b8c-sjr8g -n monitor-sa
Events:
  Type     Reason   Age                 From     Message
  ----     ------   ----                ----     -------
  Normal   Pulled   19m (x5 over 20m)   kubelet  Container image "prom/prometheus:v2.2.1" already present on machine
  Normal   Created  19m (x5 over 20m)   kubelet  Created container prometheus
  Normal   Started  19m (x5 over 20m)   kubelet  Started container prometheus
  Warning  BackOff  28s (x96 over 20m)  kubelet  Back-off restarting failed container
没有什么有用信息。随后使用kubectl logs 查看日志分析如下:
[root@master prometheus]# kubectl logs prometheus-server-7f695b5b8c-sjr8g -n monitor-sa
level=info ts=2024-03-22T02:09:58.351757651Z caller=main.go:220 msg="Starting Prometheus" version="(version=2.2.1, branch=HEAD, revision=bc6058c81272a8d938c05e75607371284236aadc)"
level=info ts=2024-03-22T02:09:58.351849801Z caller=main.go:221 build_context="(go=go1.10, user=root@149e5b3f0829, date=20180314-14:15:45)"
level=info ts=2024-03-22T02:09:58.351869228Z caller=main.go:222 host_details="(Linux 3.10.0-1160.el7.x86_64 #1 SMP Mon Oct 19 16:18:59 UTC 2020 x86_64 prometheus-server-7f695b5b8c-sjr8g (none))"
level=info ts=2024-03-22T02:09:58.351881838Z caller=main.go:223 fd_limits="(soft=1048576, hard=1048576)"
level=info ts=2024-03-22T02:09:58.354682934Z caller=main.go:504 msg="Starting TSDB ..."
level=info ts=2024-03-22T02:09:58.355414081Z caller=web.go:382 component=web msg="Start listening for connections" address=0.0.0.0:9090
level=info ts=2024-03-22T02:09:58.409721167Z caller=main.go:398 msg="Stopping scrape discovery manager..."
level=info ts=2024-03-22T02:09:58.409782698Z caller=main.go:411 msg="Stopping notify discovery manager..."
level=info ts=2024-03-22T02:09:58.409791432Z caller=main.go:432 msg="Stopping scrape manager..."
level=info ts=2024-03-22T02:09:58.409806964Z caller=manager.go:460 component="rule manager" msg="Stopping rule manager..."
level=info ts=2024-03-22T02:09:58.409827294Z caller=manager.go:466 component="rule manager" msg="Rule manager stopped"
level=info ts=2024-03-22T02:09:58.409847652Z caller=notifier.go:512 component=notifier msg="Stopping notification manager..."
level=info ts=2024-03-22T02:09:58.409870671Z caller=main.go:394 msg="Scrape discovery manager stopped"
level=info ts=2024-03-22T02:09:58.409907125Z caller=main.go:407 msg="Notify discovery manager stopped"
level=info ts=2024-03-22T02:09:58.410005048Z caller=main.go:426 msg="Scrape manager stopped"
level=info ts=2024-03-22T02:09:58.410020814Z caller=main.go:573 msg="Notifier manager stopped"
level=error ts=2024-03-22T02:09:58.41002925Z caller=main.go:582 err="Opening storage failed open block /prometheus/01HRVMTHEGRSGZZXV7A239KRNG: tombstones header: invalid size"
level=info ts=2024-03-22T02:09:58.410047134Z caller=main.go:584 msg="See you next time!"
报错原因是:err="Opening storage failed open block /prometheus/01HRVMTHEGRSGZZXV7A239KRNG: tombstones header: invalid size"
百度了下说是"Tombstones header: invalid size" 这个错误信息通常与 Prometheus 的数据块(block)或墓碑文件(tombstone file)的头部大小不正确有关。在 Prometheus 中,墓碑文件是用来标记那些已经从磁盘中删除或清理的数据块的,以避免在重新启动时重新处理这些旧数据。
进入到对应节点所配置的存储目录/data,进入01HRVMTHEGRSGZZXV7A239KRNG文件,也没有查出什么问题,磁盘空间也是正常的。
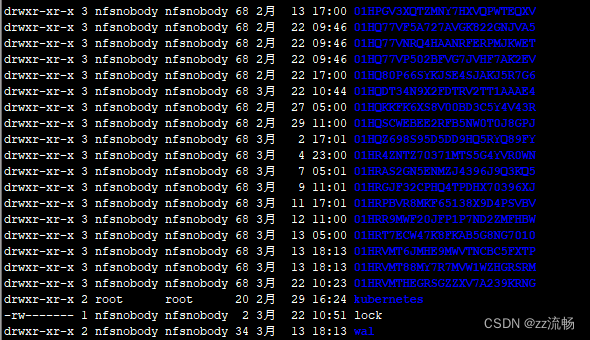
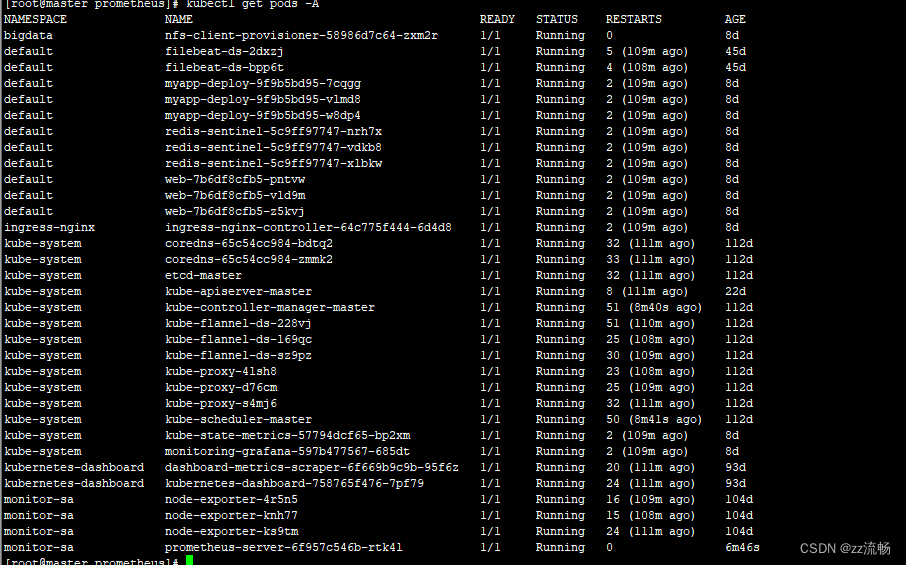
错误根本就是集群无法访问这个文件夹写入数据导致,因为是测试环境,我就删除了这个01HRVMTHEGRSGZZXV7A239KRNG,重新启动pod后 恢复正常。


 3656
3656


 被折叠的 条评论
为什么被折叠?
被折叠的 条评论
为什么被折叠?
 到【灌水乐园】发言


