


由于朋友需要把C1WebChart.替换掉,改用开源的ZedGraph控件.以下做一个示例,供大家参考:
步骤如下:
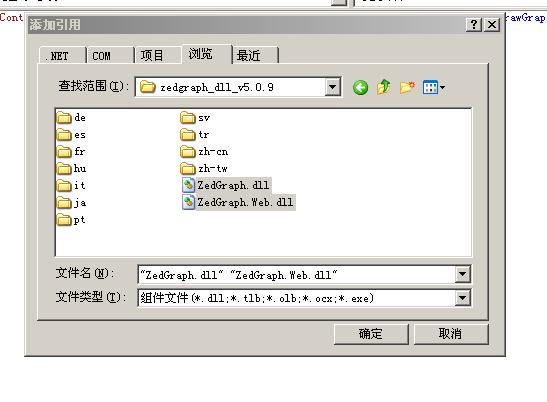
1、添加ZedGraph控件。如下图:
2、添加到控制面版。如下图: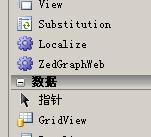
3、制作用户控件。
a> 建立一个命名为: DrawGrap.ascx 用户控件。
b> 通过控制面版,把ZedGraphWeb拖到默认页面。 如下图: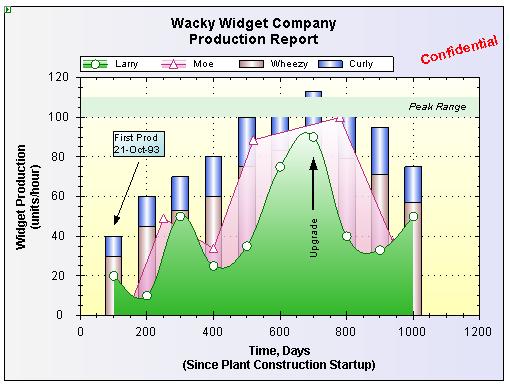
c> 生成代码(DrawGrap.ascx)如下:
 <%
@ Control Language
=
"
C#
"
AutoEventWireup
=
"
true
"
CodeFile
=
"
DrawGrap.ascx.cs
"
Inherits
=
"
DrawGrap
"
%>
<%
@ Register TagPrefix
=
"
zgw
"
Namespace
=
"
ZedGraph.Web
"
Assembly
=
"
ZedGraph.Web
"
%>
<
ZGW:ZEDGRAPHWEB id
=
"
zedGraphControl
"
runat
=
"
server
"
width
=
"
500
"
Height
=
"
375
"
RenderMode
=
"
ImageTag
"
/>
<%
@ Control Language
=
"
C#
"
AutoEventWireup
=
"
true
"
CodeFile
=
"
DrawGrap.ascx.cs
"
Inherits
=
"
DrawGrap
"
%>
<%
@ Register TagPrefix
=
"
zgw
"
Namespace
=
"
ZedGraph.Web
"
Assembly
=
"
ZedGraph.Web
"
%>
<
ZGW:ZEDGRAPHWEB id
=
"
zedGraphControl
"
runat
=
"
server
"
width
=
"
500
"
Height
=
"
375
"
RenderMode
=
"
ImageTag
"
/>
d> 生成代码(DrawGrap.ascx.cs)如下:
using
System;
using
System.Data;
using
System.Configuration;
using
System.Collections;
using
System.Web;
using
System.Web.Security;
using
System.Web.UI;
using
System.Web.UI.WebControls;
using
System.Web.UI.WebControls.WebParts;
using
System.Web.UI.HtmlControls;
using
System.Drawing;
using
ZedGraph;
using
ZedGraph.Web;
using
System.Collections.Generic;
 /**/
/// <summary>
/**/
/// <summary> /// 显示统计图形类型
 /// </summary>
public
enum
AnalyticsType
...
{ Line, //折线图 Bar, //柱状图 Pie //饼图}
;
public
partial
class
DrawGrap : System.Web.UI.UserControl
...
{
/// </summary>
public
enum
AnalyticsType
...
{ Line, //折线图 Bar, //柱状图 Pie //饼图}
;
public
partial
class
DrawGrap : System.Web.UI.UserControl
...
{
 Private Attribute#region Private Attribute /**//// <summary> /// 默认颜色种类
 /// </summary> private List<Color> defaultColors = new List<Color>(); /**//// <summary> /// 统计的个数 /// </summary> private int Count; #endregion Public Property#region Public Property /**//// <summary> /// 统计图的名称 /// </summary> public string Title; /**//// <summary> /// 横轴的名称(饼图不需要) /// </summary> public string XAxisTitle; /**//// <summary> /// 纵轴的名称(饼图不需要) /// </summary> public string YAxisTitle; /**//// <summary> /// 显示的曲线类型:Line,Bar,Pie /// </summary> public AnalyticsType Type; /**//// <summary> /// 折线图和柱状图的数据源 /// </summary> public List<PointPairList> DataSource = new List<PointPairList>(); /**//// <summary> /// 饼图的数据源 /// </summary> public List<double> ScaleData = new List<double>(); /**//// <summary> /// 各段数据的颜色 /// </summary> public List<Color> Colors = new List<Color>(); /**//// <summary> /// 各段数据的名称 /// </summary> public List<string> NameList = new List<string>(); /**//// <summary> /// 用于柱状图,每个圆柱体表示的含义 /// </summary> public List<string> LabelList = new List<string>(); #endregion protected void Page_Load(object sender, EventArgs e) ...{ zedGraphControl.RenderGraph += new ZedGraph.Web.ZedGraphWebControlEventHandler(zedGraphControl_RenderGraph); } private void InitDefaultColors() ...{ defaultColors.Add(Color.Red); defaultColors.Add(Color.Green); defaultColors.Add(Color.Blue); defaultColors.Add(Color.Yellow); defaultColors.Add(Color.YellowGreen); defaultColors.Add(Color.Brown); defaultColors.Add(Color.Aqua); defaultColors.Add(Color.Cyan); defaultColors.Add(Color.DarkSeaGreen); defaultColors.Add(Color.Indigo); } /**//// <summary> /// 如果属性为空则初始化属性数据 /// </summary> private void InitProperty() ...{ InitDefaultColors(); if (string.IsNullOrEmpty(Title)) ...{ Title = "未命名统计图"; } if (string.IsNullOrEmpty(XAxisTitle)) ...{ XAxisTitle = "横轴"; } if (string.IsNullOrEmpty(YAxisTitle)) ...{ YAxisTitle = "纵轴"; } if (Type == AnalyticsType.Pie) ...{ Count = ScaleData.Count; } else ...{ Count = DataSource.Count; } if (Colors.Count == 0 || Colors.Count != Count) ...{ Random r = new Random(); int tempIndex = 0; List<int> tempIndexList = new List<int>(); for (int i = 0; i < Count; i++) ...{ tempIndex = r.Next(defaultColors.Count); if (tempIndexList.Contains(tempIndex)) ...{ i--; } else ...{ tempIndexList.Add(tempIndex); Colors.Add(defaultColors[tempIndex]); } } } if (NameList.Count == 0) ...{ if (Type == AnalyticsType.Bar) ...{ for (int i = 0; i < DataSource[0].Count; i++) ...{ NameList.Add("第" + i.ToString() + "组"); } } else ...{ for (int i = 0; i < Count; i++) ...{ NameList.Add("第" + i.ToString() + "组"); } } } if (LabelList.Count == 0) ...{ for (int i = 0; i < Count; i++) ...{ LabelList.Add("含义" + i.ToString()); } } } /**//// <summary> /// 画图 /// </summary> /// <param name="webObject"></param> /// <param name="g"></param> /// <param name="pane"></param> private void zedGraphControl_RenderGraph(ZedGraph.Web.ZedGraphWeb webObject, System.Drawing.Graphics g, ZedGraph.MasterPane pane) ...{ InitProperty(); GraphPane myPane = pane[0]; myPane.Title.Text = Title; myPane.XAxis.Title.Text = XAxisTitle; myPane.YAxis.Title.Text = YAxisTitle; //if (true) //{ // DrawMessage(myPane, "yiafdhaskjhfasfksahfasdlhfaslf lasgfasglgsadi"); // pane.AxisChange(g); // return; //} switch (Type) ...{ case AnalyticsType.Line: DrawLine(myPane); break; case AnalyticsType.Bar: DrawBar(myPane); break; case AnalyticsType.Pie: DrawPie(myPane); break; default: break; } pane.AxisChange(g); } Draw#region Draw /**//// <summary> /// 画折线图 /// </summary> /// <param name="graphPane"></param> private void DrawLine(GraphPane graphPane) ...{ for (int i = 0; i < Count; i++) ...{ graphPane.AddCurve(NameList[i], DataSource[i], Colors[i], SymbolType.None); } } /**//// <summary> /// 画柱状图 /// </summary> /// <param name="graphPane"></param> private void DrawBar(GraphPane graphPane) ...{ for (int i = 0; i < Count; i++) ...{ graphPane.AddBar(LabelList[i], DataSource[i], Colors[i]).Bar.Fill = new Fill(Colors[i], Color.White, Colors[i]); } graphPane.XAxis.MajorTic.IsBetweenLabels = true; string[] labels = NameList.ToArray(); graphPane.XAxis.Scale.TextLabels = labels; graphPane.XAxis.Type = AxisType.Text; graphPane.Fill = new Fill(Color.White, Color.FromArgb(200, 200, 255), 45.0f); graphPane.Chart.Fill = new Fill(Color.White, Color.LightGoldenrodYellow, 45.0f); } /**//// <summary> /// 画饼图 /// </summary> /// <param name="graphPane"></param> private void DrawPie(GraphPane graphPane) ...{ graphPane.Fill = new Fill(Color.White, Color.Silver, 45.0f); graphPane.Legend.Position = LegendPos.Float; graphPane.Legend.Location = new Location(0.95f, 0.15f, CoordType.PaneFraction, AlignH.Right, AlignV.Top); graphPane.Legend.FontSpec.Size = 20f; graphPane.Legend.IsHStack = false; for (int i = 0; i < Count; i++) ...{ graphPane.AddPieSlice(ScaleData[i], Colors[i], Color.White, 45f, 0, NameList[i]); } } /**//// <summary> /// 如果系统出错,显示错误信息 /// </summary> /// <param name="graphPane"></param> /// <param name="message"></param> private void DrawMessage(GraphPane graphPane, string message) ...{ TextObj text = new TextObj(message, 200, 200); text.Text = message; graphPane.GraphObjList.Add(text); } #endregion }
e> 用户控件制作完成。
4、对控件的使用。
a> 创建测试页面(DrawGrap.aspx)
b> 把用户控件DrawGrap.ascx 拖到默认的测试页面上(DrawGrap.aspx)
c> 后台代码如下:
using
System;
using
System.Data;
using
System.Configuration;
using
System.Collections;
using
System.Web;
using
System.Web.Security;
using
System.Web.UI;
using
System.Web.UI.WebControls;
using
System.Web.UI.WebControls.WebParts;
using
System.Web.UI.HtmlControls;
public
partial
class
DrawGrap : System.Web.UI.Page
...
{ protected void Page_Load(object sender, EventArgs e) ...{ //柱状图 DrawBar(); //饼图 //DrawPie(); //曲线图 //DrawLine(); } private void DrawBar() ...{ DrawGrap1.Type = AnalyticsType.Bar; DrawGrap1.Title = "用户访问柱状图"; DrawGrap1.XAxisTitle = "月份"; DrawGrap1.YAxisTitle = "用户访问数量"; Random rand = new Random(); for (int i = 0; i < 6; i++) ...{ ZedGraph.PointPairList ppl = new ZedGraph.PointPairList(); for (int j = 0; j < 3; j++) ...{ double x = rand.Next(10); double y = rand.NextDouble() * 1000; ppl.Add(x, y); } DrawGrap1.DataSource.Add(ppl); } } private void DrawPie() ...{ DrawGrap1.Type = AnalyticsType.Pie; DrawGrap1.Title = "用户访问饼图"; Random rand = new Random(); for (int i = 0; i < 3; i++) ...{ DrawGrap1.ScaleData.Add((i + 2) * rand.Next(100)); DrawGrap1.NameList.Add(i.ToString()); } } private void DrawLine() ...{ DrawGrap1.Type = AnalyticsType.Line; DrawGrap1.Title = "用户访问曲线图"; DrawGrap1.XAxisTitle = "月份"; DrawGrap1.YAxisTitle = "用户访问数量"; Random rand = new Random(); for (int i = 0; i < 3; i++) ...{ ZedGraph.PointPairList ppl = new ZedGraph.PointPairList(); for (double x = 0; x < 5; x += 1.0) ...{ double y = rand.NextDouble() * 1000; ppl.Add(x, y); } DrawGrap1.DataSource.Add(ppl); DrawGrap1.NameList.Add(i.ToString()); } }}
d> 生成的柱状图如下: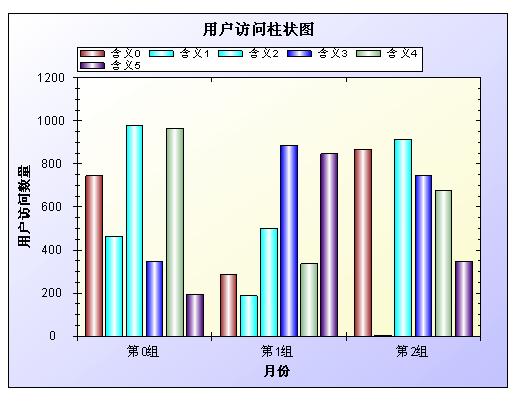
e> 生成的曲线图如下: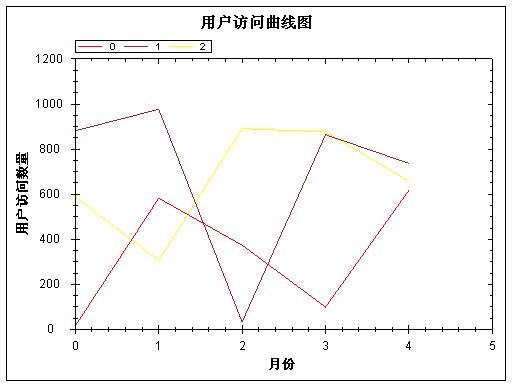
f> 生成的饼图如下: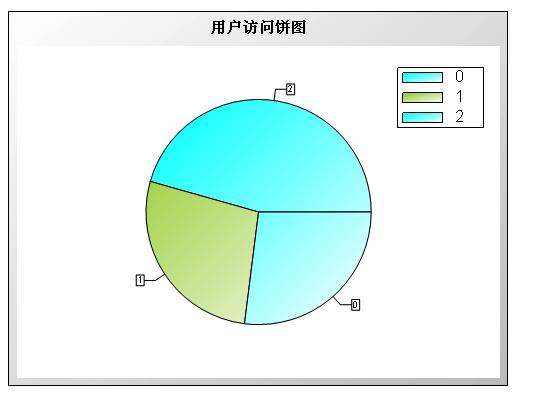
5、补充说明
a> 成功部署该项目需要在虚拟网站建临时文件夹(ZedGraphImages),便于存放生成的临时文件。
b> 据说该控件支持3D图效果,具体我没测试。希望有兴趣的同学可以测试。
(这些图一般的项目应用就足够了。)


 3205
3205

 被折叠的 条评论
为什么被折叠?
被折叠的 条评论
为什么被折叠?
 到【灌水乐园】发言


