


1.多色渐变柱状图
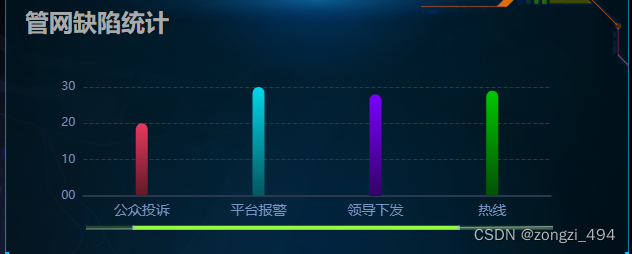
this.Wtlxzb.xAxis = ["巡杳上报", '公众投诉', '平台报警', '领导下发', '热线', '其他'];
this.Wtlxzb.yAxis = [15, 20, 30, 28, 29, 33, 44];
this.Wtlxzb.refresh = Math.random();
<template>
  <div ref="echarts"
       style="width:100%;height:100%;"
       class="heights"></div>
</template>
<script>
import * as echarts from "echarts";

export default {
  props: {
    // x轴数据
    xAxis: {
      type: Array,
      default: () => {
        return []
      }
    },
    // y轴数据
    yAxis: {
      type: Array,
      default: () => {
        return []
      }
    },
    // 刷新
    refresh: {
      type: Number
    }
  },
  data () {
    return {
      chart: null,
    };
  },
  watch: {
    refresh () {
      if (this.chart) {
        this.chart.dispose();
        this.chart = null;
      }
      this.initChart();
    },
  },
  mounted () {
    this.initChart();
    window.addEventListener("resize", this.resizeChart);
  },
  methods: {
    //初始化图表
    initChart () {
      this.chart = echarts.init(this.$refs.echarts);
      let option = {
        // color: ["#ab2b46", "#7c00ff", "#4cabce",],
        // legend: {
        //   // itemGap: 5
        //   itemStyle: {
        //     color: 'inherit',
        //   },
        //   textStyle: {
        //     color: "auto"
        //   },
        //   itemWidth: 15,
        //   itemHeight: 15,
        // },
        tooltip: {
          trigger: "axis",
          // formatter: "{b}:{c}件",
          // formatter: "{b}:{c}",
          feature: {
            mark: { show: true },
            dataView: { show: true, readOnly: false },
            magicType: { show: true, type: ['line', 'bar'] },
            restore: { show: true },
            saveAsImage: { show: true }
          },
          axisPointer: {
            type: "cross",
            textStyle: {
              color: "#fff"
            }
          },
        },
        grid: {
          top: 50,
          bottom: 50,
        },
        xAxis: [
          {
            type: "category",
            axisLine: {
              lineStyle: {
                width: 2,
                color: "#2A384D",
              }
            },
            splitLine: {
              show: false,
            },
            axisTick: {
              show: false,
            },
            axisLabel: {
              color: "#7794C3",
              fontSize: 14,
              fontFamily: "AlibabaPuHuiTi",
            },
            data: this.xAxis,
          }
        ],
        yAxis: [
          {
            type: "value",
            // name: "件",
            nameTextStyle: {
              align: "right",
              color: "#7794C3",
              fontSize: 14,
              fontFamily: "AlibabaPuHuiTi",
              padding: [0, 8, 0, 0],
            },
            splitLine: {
              show: true,
              lineStyle: {
                type: "dashed",
                color: "#2A384D",
              }
            },
            axisLine: {
              show: false,
            },
            axisTick: {
              show: false
            },
            min: 0,
            splitNumber: 4,
            minInterval: 1,
            axisLabel: {
              color: "#7794C3",
              fontSize: 12,
              fontFamily: "AlibabaPuHuiTi",
              formatter: function (value) {
                let texts = [];
                if (value === 0) {
                  texts.push("00");
                } else {
                  texts.push(value);
                }
                return texts;
              }
            },
          }
        ],
        dataZoom: [
          {
            show: true,
            // show: false,
            height: 4,
            bottom: 18,
            start: 10,
            end: 80,
            handleSize: '100%',
            fillerColor: "#94FA41",
            borderColor: "transparent",
            backgroundColor: "rgba(148, 250, 65, 0.2)",
            handleStyle: {
              color: "#94FA41",
            },
            moveHandleSize: 0,
            textStyle: {
              color: "#fff"
            },
          },
          {
            type: "inside",
            show: true,
            height: 15,
            start: 1,
            end: 35
          }
        ],
        series: [
          {
            name: '数量',
            type: "bar",
            barWidth: 12,
            itemStyle: {
              borderRadius: [6, 6, 0, 0],

              color: function (params) {
                var colorList = [
                  ['#023464', '#007EF2'],
                  ['#5e1929', '#E8395D'],
                  ['#025760', '#00D7E9'],
                  ['#320367', '#7B00FD'],
                  ['#025105', '#00C800'],
                  ['#4f5256', '#FFE899'],
                  ['#4f5256', '#83FFE9']
                ];

                var colorItem = colorList[params.dataIndex];
                return new echarts.graphic.LinearGradient(0, 1, 0, 0, [
                  {
                    offset: 0,
                    color: colorItem[0],
                  },
                  {
                    offset: 1,
                    color: colorItem[1],
                  }
                ], false);
              }

              // color: function(params) {
              //   	//注意,如果颜色太少的话,后面颜色不会自动循环,最好多定义几个颜色
              //       var colorList = ['#c23531','#2f4554', '#61a0a8', '#d48265', '#91c7ae','#749f83', '#ca8622'];
              //       return colorList[params.dataIndex]
              //   }
            },
            // showBackground: true,
            backgroundStyle: {
              color: "transparent",
              borderWidth: 1,
              borderColor: "rgba(148, 250, 65, 0.2)",
            },
            data: this.yAxis,
          },
        ]
      };
      this.chart.setOption(option);
    },
    resizeChart () {
      if (this.chart) {
        this.chart.resize();
      }
    }
  },
  destroyed () {
    if (this.chart) {
      this.chart.dispose();
    }
  }
};
</script>

<style lang="scss">
.heights {
  min-width: 532px;
}
</style>
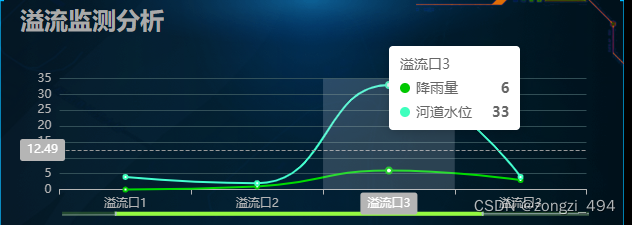
2.多色折线图
chartInfo: {
    refresh: 1,
    DataName: '',
    XAxis: ["溢流口1", "溢流口2", "溢流口3", "溢流口3", "溢流口4"],
    typeName: '1',
    typeName2: '2',
    YAxis: [0, 1, 6, 3, 4],
    YAxis2: [4, 2, 33, 4, 1, 5],
    loading: false
  },
<template>
  <!-- <div style="width: 100%; height: 100%" ref="lineChart" class="heightclass"></div> -->
  <div style="width:100%; height:100%">
    <div class="chartname">{{DataName}}</div>
    <div ref="lineChart" class="heightclass"></div>
  </div>
</template>

<script>
import * as echarts from "echarts";

export default {
  props: {
    //x轴数据
    XAxis: {
      type: Array,
      default: () => []
    },
    //y轴数据
    YAxis: {
      type: Array,
      default: () => []
    },
    YAxis2: {
      type: Array,
      default: () => []
    },
    //名字
    DataName: {
      type: String,
    },
    //类型
    typeName: {
      type: String,
      default: '1'
    },
    typeName2: {
      type: String,
      default: '2'
    },
    //刷新
    refresh: {
      type: Number
    }
  },
  data () {
    return {
      chart: null
    }
  },
  mounted () {
    this.initChart();
    window.addEventListener("resize", this.resizeChart);
  },
  watch: {
    refresh () {
      if (this.chart) {
        this.chart.dispose();
        this.chart = null;
      }
      this.initChart();
    }
  },
  methods: {
    //初始化图表
    initChart () {
      this.chart = echarts.init(this.$refs.lineChart);

      let that = this

      let option = {
        color: ["#00C800", "#3effbd"],
        // tooltip: {
        //   trigger: 'axis',
        //   formatter: function (params) {
        //     let typeName = that.typeName
        //     let typeName2 = that.typeName2

        //     // console.log('params', params);
        //     return `地点 :${params[0].name}<br>${typeName}:${params[0].value}mm<br>${typeName2}:${params[1].value}m`;
        //     // return `时间:${params[0].name}<br>${typeName}:${params[0].value}mm`;

        //   },
        //   axisPointer: {
        //     type: 'cross'
        //   },
        //   textStyle: {
        //     color: '#fff',
        //     fontStyle: 'normal',
        //     fontFamily: '微软雅黑',
        //     fontSize: 12,
        //   },
        //   // backgroundColor: "transparent",
        //   backgroundColor: "#071a41",
        // },

        tooltip: {
          trigger: "axis",
          // formatter: "{b}:{c}件",
          // formatter: "{b}:{c}",
          feature: {
            mark: { show: true },
            dataView: { show: true, readOnly: false },
            magicType: { show: true, type: ['line', 'bar'] },
            restore: { show: true },
            saveAsImage: { show: true }
          },
          axisPointer: {
            type: "cross",
            textStyle: {
              color: "#fff"
            }
          },
        },

        grid: {
          top: '18%',
          left: '3%',
          right: '3%',
          bottom: '12%',
          containLabel: true
        },
        xAxis: [
          {
            type: "category",
            data: this.XAxis,
            axisPointer: {
              type: "shadow",
            },
            axisLabel: {
              show: true,
              color: "#b5b5b5", //灰色

            },
            axisLine: {
              lineStyle: {
                // color: "#3398DB"  //蓝色
                color: "#b5b5b5", //灰色

              },
            },
          },
        ],
        yAxis: [
          {
            // name: '降雨量',
            type: "value",
            axisLabel: {
              show: true,
              // color: "#00C800", // 绿色
              color: "#b5b5b5", //灰色

            },
            axisLine: {
              lineStyle: {
                color: "#b5b5b5", //灰色
                // color: "#00C800", // 绿色
              },
            },
            splitLine: {
              show: true,
              lineStyle: {
                color: 'rgba(61,91,98,0.8)',

                // color: "#00C800", // 绿色

                // type: "dashed"  //虚线
              }
            }
          },
          {
            inverse: true,  //控制x轴在上方
            // name: '河道水位',
            type: "value",
            axisLabel: {
              show: true,
              // color: "#3effbd"
              color: "#b5b5b5",

            },
            axisLine: {
              lineStyle: {
                color: "#3398DB", // 颜色

                // color: "#00C800", // 颜色

              },
            },
            splitLine: {
              show: false,
              lineStyle: {
                color: 'rgba(61,91,98,0.8)',
                type: "dashed"
              }
            }
          },
        ],
        dataZoom: [
          {
            show: true,
            // show: false,
            height: 4,
            bottom: 18,
            start: 10,
            end: 80,
            handleSize: '100%',
            fillerColor: "#94FA41",
            borderColor: "transparent",
            backgroundColor: "rgba(148, 250, 65, 0.2)",
            handleStyle: {
              color: "#94FA41",
            },
            moveHandleSize: 0,
            textStyle: {
              color: "#fff"
            },
          },
          {
            type: "inside",
            show: true,
            height: 15,
            start: 1,
            end: 35
          }
        ],
        series: [
          {
            smooth: true,//变为曲线 默认false折线
            name: '降雨量',
            type: "line",
            data: this.YAxis,
          },
          {
            smooth: true,//变为曲线 默认false折线
            name: '河道水位',
            type: "line",
            // yAxisIndex: 1,
            data: this.YAxis2,
          },
        ]
      };
      this.chart.setOption(option);
    },
    resizeChart () {
      if (this.chart) {
        this.chart.resize();
      }
    }
  }
}
</script>

<style lang="scss" scoped>
.heightclass {
  min-height: 180px;
  min-width: 540px;

  // height: calc(100% - 40px);
  height: 100%;
  width: 100%;
}
</style>
3.饼状图/多色渐变柱状图
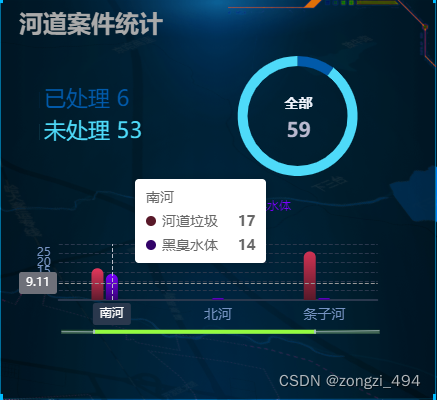
   this.chartInfo2.data = [
          { value: '0', name: '已处理', },
          { value: '0', name: '未处理', },
        ]
        this.chartInfo2.total = 0
<template>
  <div ref=""
       class="heightclass"
       style="width: 100%; height: 100%">
  </div>
</template>

<script>
// import * as echarts from "echarts";
// import { guid } from "../util/utils";


export default {
  props: {
    width: {
      type: String,
      default: '100%',
    },
    height: {
      type: String,
      default: '100%',
    },
    chartData: {
      type: Object,
      default: () => {
        return {}
      },
    },
    //刷新
    refresh: {
      type: Number
    }
  },
  data () {
    return {
      chart: null,
      data: {},
    }
  },
  watch: {
    // chartData: {
    //   deep: true,
    //   handler () {
    //     this.initChart()
    //   },
    // },

    refresh () {
      if (this.chart) {
        this.chart.dispose();
        this.chart = null;
      }
      this.initChart();
    }
  },
  mounted () {
    // console.log(this.chartData)
    this.initChart()
    window.addEventListener("resize", this.resizeChart);
  },
  methods: {
    initChart () {
      this.chart = this.$echarts.init(this.$el, 'dark')
      this.chart.setOption({
        color: ["#015aaa", "#4edaf9", "#fd8258",],
        title: {
          show: true,
          text: '全部',
          // 这是总量,从后端获取数据
          subtext: this.chartData.total,
          top: '35%',
          left: '69%',
          textAlign: 'center',
          z: 0,
          textStyle: {
            fontSize: '14',
            fontWeight: 'bold'
          },
          subtextStyle: {
            fontSize: '20',
            fontWeight: 'bold'
          }
        },
        tooltip: {
          show: false,
          trigger: 'item',
          alwaysShowContent: true,
          formatter: '{a} <br/>{b}: {c} ({d}%)'
        },
        legend: {
          orient: 'vertical',
          y: 'center',    //延Y轴居中
          x: 'left', //居右显示
          align: 'left', //图例控制在左边
          padding: [
            0, // 上
            200, // 右
            0, // 下
            20, // 左
          ],
          itemWidth: 0.1,
          itemHeight: 0.1,


          itemStyle: {
            // opacity: 0
            // icon: ''
          },

          itemHeight: 15,
          formatter: (name) => {
            // var index = 0
            // var clientlabels = this.chartData.name
            // var clientcounts = this.chartData.value
            // clientlabels.forEach(function (value, i) {
            //   if (value == name) {
            //     index = i
            //   }
            // })
            // let res

            // if (name) {
            //   // res = '{another|' + clientcounts[index] + '}' + '' + name
            //   res = `${clientcounts[index]} ${name}`
            // }

            // return res
            let legenTile = name + ' '

            for (const item of this.chartData.data) {
              if (name === item.name) legenTile += item.value
            }

            return legenTile
          },
          textStyle: {
            color: 'auto',
            rich: {
              another: {
                fontSize: 28,
              },
            },
            fontSize: 22,
          },
        },
        backgroundColor: 'rgba(0, 20, 70, 0)', //背景色
        series: [
          {
            name: '案件统计',
            type: 'pie',
            radius: [50, 60],
            center: ['70%', '50%'],
            legendHoverLink: false,
            avoidLabelOverlap: false,
            textAlign: 'center',
            label: {
              // 此处重点,设置为显示
              show: false,
              position: 'center',
              formatter: '{b}\n{c}',
              align: 'center',
              verticalAlign: 'middle',
              // 此处重点,字体大小设置为0
              textStyle: {
                fontSize: '0'
              },
              emphasis: {
                show: true,
                textStyle: {
                  fontSize: '20',
                  fontWeight: 'bold'
                },
                // 同步样式
                formatter: function (params) {
                  return `{tTitle|${params.name}}\n{tSubTitle|${params.value}}`
                },
                rich: {
                  tTitle: {
                    fontSize: '14',
                    fontWeight: 'bold',
                    lineHeight: '25'
                  },
                  tSubTitle: {
                    fontSize: '20',
                    fontWeight: 'bold',
                    lineHeight: '25'
                  }
                }
              },
            },
            // roseType: 'area',
            // itemStyle: {
            //   borderRadius: 8,
            // },

            // itemStyle: {
            //   borderRadius: 20,
            //   borderColor: '#0014462e',
            //   borderWidth: 2,
            // },
            data: this.chartData.data,
          },
        ],
      })

      this.chart.dispatchAction({
        type: 'showTip',
        // 系列的 index,在 tooltip 的 trigger 为 axis 的时候可选。
        seriesIndex: 0,
        // 数据的 index,如果不指定也可以通过 name 属性根据名称指定数据
        dataIndex: 0,
        // 可选,数据名称,在有 dataIndex 的时候忽略
        // name: string,
        // 本次显示 tooltip 的位置。只在本次 action 中生效。
      })

      this.chart.on('mouseover', { seriesName: '案件统计' }, params => {
        this.chart.setOption({
          title: {
            show: false
          }
        })
      })

      this.chart.on('mouseout', { seriesName: '案件统计' }, params => {
        this.chart.setOption({
          title: {
            show: true
          }
        })
      })


      //   setTimeout(() => {
      //     chart.dispatchAction({
      //       type: 'legendSelect',
      //       // 图例名称
      //       name: '氨氮',
      //     })
      //   },1000)
    },
    resizeChart () {
      if (this.chart) {
        this.chart.resize();
      }
    }
  },
}
</script>

<style lang="scss" scoped>
p {
  // line-height: 60px;
  // text-align: center;
  // color: rgba(255, 255, 255, 0);
}

.heightclass {
  min-height: 150px;
}

.center-flex {
  top: 50%;
  left: 50%;
  transform: translate(-50%, -50%);
  position: absolute;
  color: #015aaa;
  text-align: center;
}
</style>
下面是多色渐变柱状图
 this.wfajEchart.xAxis = ['无']
 this.wfajEchart.yAxis = [
  { name: '无', values: '0' }
];
this.wfajEchart.refresh = Math.random();
<template>
  <div ref="echarts"
       style="width:100%;height:100%;"></div>
</template>
<script>
import * as echarts from "echarts";

export default {
  props: {
    // x轴数据
    xAxis: {
      type: Array,
      default: () => {
        return []
      }
    },
    // y轴数据
    yAxis: {
      type: Array,
      default: () => {
        return []
      }
    },

    // 刷新
    refresh: {
      type: Number
    }
  },
  data () {
    return {
      chart: null,
    };
  },
  watch: {
    refresh () {
      if (this.chart) {
        this.chart.dispose();
        this.chart = null;
      }
      this.initChart();
    },
  },
  mounted () {
    this.initChart();
    window.addEventListener("resize", this.resizeChart);
  },
  methods: {
    //初始化图表
    initChart () {
      this.chart = echarts.init(this.$refs.echarts);
      let option = {
        color: ["#ab2b46", "#7c00ff", "#4cabce",],
        legend: {
          // data: ['防坠网缺失', '管网渗漏', '井盖破损'],
          // itemGap: 5
          itemStyle: {
            color: 'inherit',
          },
          textStyle: {
            color: "auto"
          },
          itemWidth: 15,
          itemHeight: 15,
        },
        tooltip: {
          trigger: "axis",
          // formatter: "{b}:{c}件",
          // formatter: "{b}:{c}",
          feature: {
            mark: { show: true },
            dataView: { show: true, readOnly: false },
            magicType: { show: true, type: ['line', 'bar'] },
            restore: { show: true },
            saveAsImage: { show: true }
          },
          axisPointer: {
            type: "cross",
            textStyle: {
              color: "#fff"
            }
          },
        },
        grid: {
          top: 50,
          bottom: 50,
        },
        xAxis: [
          {
            type: "category",
            axisLine: {
              lineStyle: {
                width: 2,
                color: "#2A384D",
              }
            },
            splitLine: {
              show: false,
            },
            axisTick: {
              show: false,
            },
            axisLabel: {
              color: "#7794C3",
              fontSize: 14,
              fontFamily: "AlibabaPuHuiTi",
            },
            data: this.xAxis,
          }
        ],
        yAxis: [
          {
            type: "value",
            // name: "件",
            nameTextStyle: {
              align: "right",
              color: "#7794C3",
              fontSize: 14,
              fontFamily: "AlibabaPuHuiTi",
              padding: [0, 8, 0, 0],
            },
            splitLine: {
              show: true,
              lineStyle: {
                type: "dashed",
                color: "#2A384D",
              }
            },
            axisLine: {
              show: false,
            },
            axisTick: {
              show: false
            },
            min: 0,
            splitNumber: 4,
            minInterval: 1,
            axisLabel: {
              color: "#7794C3",
              fontSize: 12,
              fontFamily: "AlibabaPuHuiTi",
              formatter: function (value) {
                let texts = [];
                if (value === 0) {
                  texts.push("00");
                } else {
                  texts.push(value);
                }
                return texts;
              }
            },
          }
        ],
        dataZoom: [
          {
            show: true,
            // show: false,
            height: 4,
            bottom: 18,
            start: 10,
            end: 80,
            handleSize: '100%',
            fillerColor: "#94FA41",
            borderColor: "transparent",
            backgroundColor: "rgba(148, 250, 65, 0.2)",
            handleStyle: {
              color: "#94FA41",
            },
            moveHandleSize: 0,
            textStyle: {
              color: "#fff"
            },
          },
          {
            type: "inside",
            show: true,
            height: 15,
            start: 1,
            end: 35
          }
        ],
        series: [
          {
            name: this.yAxis[0] && this.yAxis[0].name,
            type: "bar",
            barWidth: 12,
            itemStyle: {
              borderRadius: [6, 6, 0, 0],
              color: function () {
                return new echarts.graphic.LinearGradient(0, 1, 0, 0, [
                  {
                    offset: 0,
                    color: "#591929",
                  },
                  {
                    offset: 1,
                    color: "#d03354",
                  }
                ], false);
              }
            },
            // showBackground: true,
            backgroundStyle: {
              color: "transparent",
              borderWidth: 1,
              borderColor: "rgba(148, 250, 65, 0.2)",
            },
            data: this.yAxis[0] && this.yAxis[0].values,
          },
          {
            name: this.yAxis[1] && this.yAxis[1].name,
            type: "bar",
            barWidth: 12,
            itemStyle: {
              borderRadius: [6, 6, 0, 0],
              color: function () {
                return new echarts.graphic.LinearGradient(0, 1, 0, 0, [
                  {
                    offset: 0,
                    color: "#320368",
                  },
                  {
                    offset: 1,
                    color: "#7000e7",
                  }
                ], false);
              }
            },
            // showBackground: true,
            backgroundStyle: {
              color: "transparent",
              borderWidth: 1,
              borderColor: "rgba(148, 250, 65, 0.2)",
            },
            data: this.yAxis[1] && this.yAxis[1].values,
          },
          {
            name: this.yAxis[2] && this.yAxis[2].name,
            type: "bar",
            barWidth: 12,
            itemStyle: {
              borderRadius: [6, 6, 0, 0],
              color: function () {
                return new echarts.graphic.LinearGradient(0, 1, 0, 0, [
                  {
                    offset: 0,
                    color: "#023565",
                  },
                  {
                    offset: 1,
                    color: "#0071d9",
                  }
                ], false);
              }
            },
            // showBackground: true,
            backgroundStyle: {
              color: "transparent",
              borderWidth: 1,
              borderColor: "rgba(148, 250, 65, 0.2)",
            },
            data: this.yAxis[2] && this.yAxis[2].values,
          },
        ]
      };
      this.chart.setOption(option);
    },
    resizeChart () {
      if (this.chart) {
        this.chart.resize();
      }
    }
  },
  destroyed () {
    if (this.chart) {
      this.chart.dispose();
    }
  }
};
</script>
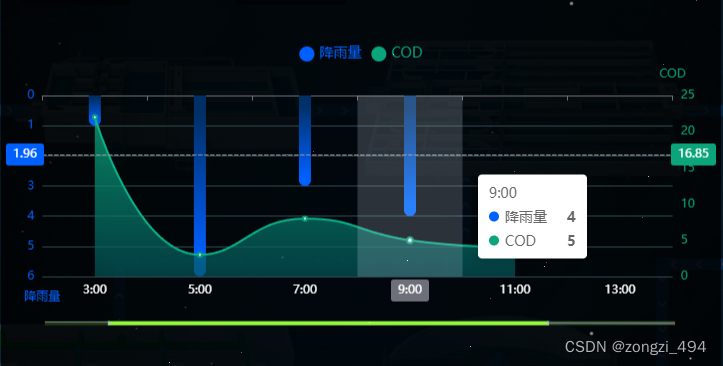
4.柱状图和折线图
      chartInfo2: {
        refresh: 1,
        DataName: "",
        XAxis: [
          "1:00",
          "3:00",
          "5:00",
          "7:00",
          "9:00",
          "11:00",
          "13:00",
          "15:00",
          "17:00",
        ],
        typeName: '降雨量',
        typeName2: 'COD',
        YAxis: [0, 1, 6, 3, 4],
        YAxis2: [4, 2, 33, 4, 1, 5],
        YAxis3: [5, 22, 3, 8, 5, 4],
        loading: false,
      },
       <LineChart2 :refresh="chartInfo2.refresh"
                          :DataName="chartInfo2.DataName"
                          :XAxis="chartInfo2.XAxis"
                          :YAxis="chartInfo2.YAxis"
                          :typeName="chartInfo2.typeName"
                          :typeName2="chartInfo2.typeName2"
                          :YAxis2="chartInfo2.YAxis2"
                          :YAxis3="chartInfo2.YAxis3" />
<template>
  <!-- <div style="width: 100%; height: 100%" ref="lineChart" class="heightclass"></div> -->
  <div style="width:100%; height:100%">
    <div class="chartname">{{DataName}}</div>
    <div ref="lineChart"
         class="heightclass"></div>
  </div>
</template>

<script>
import * as echarts from "echarts";

export default {
  props: {
    //x轴数据
    XAxis: {
      type: Array,
      default: () => []
    },
    //y轴数据
    YAxis: {
      type: Array,
      default: () => []
    },
    YAxis2: {
      type: Array,
      default: () => []
    },
    YAxis3: {
      type: Array,
      default: () => []
    },
    //名字
    DataName: {
      type: String,
    },
    //类型
    typeName: {
      type: String,
      default: '1'
    },
    typeName2: {
      type: String,
      default: '2'
    },
    //刷新
    refresh: {
      type: Number
    }
  },
  data () {
    return {
      chart: null
    }
  },
  mounted () {
    this.initChart();
    window.addEventListener("resize", this.resizeChart);
  },
  watch: {
    refresh () {
      if (this.chart) {
        this.chart.dispose();
        this.chart = null;
      }
      this.initChart();
    }
  },
  methods: {
    //初始化图表
    initChart () {
      this.chart = echarts.init(this.$refs.lineChart);

      let that = this

      let option = {
        // color: ["#0ba47b", "#0060FF"],
        color: ["#0060FF", "#0ba47b"],
        legend: {
          show: true,
          // orient: 'vertical',
          // y: 'top',    //延Y轴居中
          x: 'center', //居右显示
          align: 'left', //图例控制在左边
          icon: 'circle',

          // padding: [
          //   0, // 上
          //   200, // 右
          //   0, // 下
          //   20, // 左
          // ],
          itemWidth: 15,
          itemHeight: 15,

          itemStyle: {
            // opacity: 0
            // icon: ''
          },

          itemHeight: 15,
          textStyle: {
            color: 'auto',
            rich: {
              another: {
                fontSize: 28,
              },
            },
            fontSize: 14,
          },
        },

        tooltip: {
          trigger: "axis",
          // formatter: "{b}:{c}件",
          // formatter: "{b}:{c}",
          feature: {
            mark: { show: true },
            dataView: { show: true, readOnly: false },
            magicType: { show: true, type: ['line', 'bar'] },
            restore: { show: true },
            saveAsImage: { show: true }
          },
          axisPointer: {
            type: "cross",
            textStyle: {
              color: "#fff"
            }
          },
        },
        grid: {
          top: '18%',
          left: '3%',
          right: '3%',
          bottom: '15%',
          containLabel: true
        },
        xAxis: [
          {
            type: "category",
            data: this.XAxis,
            axisPointer: {
              type: "shadow",
            },
            axisLabel: {
              show: true,
              color: "#fff",

            },
            axisLine: {
              lineStyle: {
                // color: "#3398DB"
              },
            },
          },
        ],
        yAxis: [
          {
            inverse: true,  //控制x轴在上方
            name: this.typeName,
            type: "value",
            axisLabel: {
              show: true,
              color: "#0060FF",

            },
            axisLine: {
              lineStyle: {
                color: "#0060FF",
              },
            },
            splitLine: {
              show: true,
              lineStyle: {
                color: 'rgba(61,91,98,0.8)',
              }
            }
          },
          {
            name: this.typeName2,
            type: "value",
            axisLabel: {
              show: true,
              color: "#0ba47b",

            },
            axisLine: {
              lineStyle: {
                color: "#0ba47b",
              },
            },
            splitLine: {
              show: false,
              lineStyle: {
                color: 'rgba(61,91,98,0.8)',
              }
            }
          },
        ],
        dataZoom: [
          {
            show: true,
            // show: false,
            height: 4,
            bottom: 18,
            start: 10,
            end: 80,
            handleSize: '100%',
            fillerColor: "#94FA41",
            borderColor: "transparent",
            backgroundColor: "rgba(148, 250, 65, 0.2)",
            handleStyle: {
              color: "#94FA41",
            },
            moveHandleSize: 0,
            textStyle: {
              color: "#fff"
            },
          },
          {
            type: "inside",
            show: true,
            height: 15,
            start: 1,
            end: 35
          }
        ],
        series: [
          {
            // smooth: true,//变为曲线 默认false折线
            name: this.typeName,
            type: "bar",
            barWidth: 12,
            itemStyle: {
              borderRadius: [0, 0, 6, 6],
              color: function () {
                return new echarts.graphic.LinearGradient(0, 1, 0, 0, [
                  {
                    offset: 0.1,
                    color: '#0060ff' // 0% 处的颜色
                  },

                  {
                    offset: 0.9,
                    color: '#013068' // 100% 处的颜色
                  }
                ], false);
              }
            },
            // showBackground: true,
            backgroundStyle: {
              color: "transparent",
              borderWidth: 1,
              borderColor: "rgba(148, 250, 65, 0.2)",
            },
            data: this.YAxis,
          },
          // {
          //   smooth: true,//变为曲线 默认false折线
          //   name: '径流量',
          //   type: "line",
          //   yAxisIndex: 1,
          //   data: this.YAxis2,
          // },
          {
            smooth: true,//变为曲线 默认false折线
            name: this.typeName2,
            type: "line",
            yAxisIndex: 1,
            data: this.YAxis3,

            areaStyle: {
              normal: {
                color: {
                  x: 0,
                  y: 0,
                  x2: 0,
                  y2: 1,
                  colorStops: [
                    {
                      offset: 0,
                      color: "#0ba57c",
                    },
                    {
                      offset: 1,
                      color: "#044d50",

                    }
                  ],
                  globalCoord: false // 缺省为 false
                }
              }


            },

          },
        ]
      };
      this.chart.setOption(option);
    },
    resizeChart () {
      if (this.chart) {
        this.chart.resize();
      }
    }
  }
}
</script>

<style lang="scss" scoped>
.heightclass {
  min-height: 180px;
  // min-width: 540px;

  // height: calc(100% - 40px);
  height: 100%;
  width: 100%;
}
</style>
5.新的3D柱状图
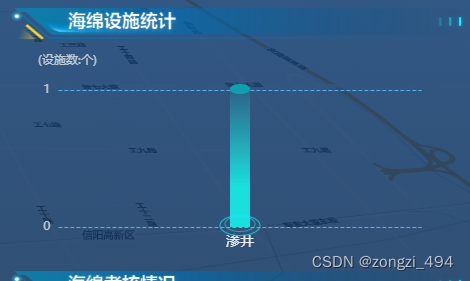
关键点就是几个series的堆叠
chartData2: {
xAxis: [‘绿色屋顶’, ‘雨水花园’, ‘透水铺装’, ‘植草沟’, ‘下沉式绿地’],
yAxis: [1, 5, 3, 4, 5, 6],
refresh: 1
},
<template>
  <div :id="id"
       style="width: 100%; height: 100%"></div>
</template>
<script>
import * as echarts from 'echarts';
import { guid } from '@/utils/ruoyi';
import { reactive, toRefs, onMounted, watch } from 'vue';
export default {
  name: 'line-chart',
  props: {
    data: Object,
    refresh: Number,
  },
  setup (props) {
    const allData = reactive({
      series: [],
      legend: [],
      id: guid(),
      chart: null,
    });
    const resizeTheChart = () => {
      if (allData.chart) {
        allData.chart.resize();
      }
    };

    const init = () => {
      let chartDom = echarts.init(document.getElementById(allData.id));

      var shadowYData = [100, 100];
      var color = "rgba(31,227,249,1)";
      var shadowColor = "#0b5767";
      var barWidth = 20;

      var option;
      option = {
        // color: ["#ab2b46", "#7c00ff", "#4cabce",],
        // legend: {
        //   // itemGap: 5
        //   itemStyle: {
        //     color: 'inherit',
        //   },
        //   textStyle: {
        //     color: "auto"
        //   },
        //   itemWidth: 15,
        //   itemHeight: 15,
        // },
        title: {
          // text: '特性示例:渐变色 阴影 点击缩放',
          subtext: '(设施数:个)',
          left: 20,
          subtextStyle: {
            fontSize: 12,
            color: 'rgba(255,255,255,0.7)'
          }

        },
        tooltip: {
          trigger: "axis",
          // formatter: "{b}:{c}件",
          formatter: "{b}:{c}",
          feature: {
            mark: { show: true },
            dataView: { show: true, readOnly: false },
            magicType: { show: true, type: ['line', 'bar'] },
            restore: { show: true },
            saveAsImage: { show: true }
          },
          axisPointer: {
            type: "cross",
            textStyle: {
              color: "#fff"
            }
          },
        },
        grid: {
          top: 50,
          bottom: 30,
        },
        xAxis: [
          {
            type: "category",
            axisLine: {
              show: false,
              lineStyle: {
                width: 2,
                color: "#58b2ed",
              }
            },
            splitLine: {
              show: false,
            },
            axisTick: {
              show: false,
            },
            axisLabel: {
              color: "rgba(255,255,255,0.9)",
              fontSize: 14,
              fontFamily: "AlibabaPuHuiTi",
            },
            data: props.data.xAxis,
          }
        ],
        yAxis: [
          {
            type: "value",
            // name: "件",
            nameTextStyle: {
              align: "right",
              color: "#7794C3",
              fontSize: 14,
              fontFamily: "AlibabaPuHuiTi",
              padding: [0, 8, 0, 0],
            },
            splitLine: {
              // show: false,
              lineStyle: {
                type: "dashed",
                color: "#58b2ed",
              }
            },
            axisLine: {
              show: false,
            },
            axisTick: {
              show: false
            },
            min: 0,
            splitNumber: 4,
            minInterval: 1,
            axisLabel: {
              color: "rgba(255,255,255,0.7)",
              fontSize: 12,
              fontFamily: "AlibabaPuHuiTi",
              formatter: function (value) {
                let texts = [];
                if (value === 0) {
                  texts.push("0");
                } else {
                  texts.push(value);
                }
                return texts;
              }
            },
          }
        ],
        dataZoom: [
          {
            // show: true,
            show: false,
            height: 4,
            bottom: 18,
            start: 0,
            end: 100,
            handleSize: '100%',
            fillerColor: "#94FA41",
            borderColor: "transparent",
            backgroundColor: "rgba(148, 250, 65, 0.2)",
            handleStyle: {
              color: "#94FA41",
            },
            moveHandleSize: 0,
            textStyle: {
              color: "#fff"
            },
          },
          {
            type: "inside",
            show: true,
            height: 15,
            start: 1,
            end: 35
          }
        ],
        "series": [
          {
            "name": "数据上椭圆",
            type: 'pictorialBar',
            symbolSize: [barWidth, 10],
            symbolOffset: [0, -6],
            symbolPosition: 'end',
            z: 12,
            // "label": {
            //   "normal": {
            //     "show": true,
            //     "position": "top",
            //     fontSize: 14,
            //     color: color,
            //     formatter: function (params, index) {
            //       return params.value + "%";
            //     }
            //   }
            // },
            color: "rgba(17, 160, 176)",
            data: props.data.yAxis
          },
          // {
          //   name: '',
          //   type: 'pictorialBar',
          //   symbolSize: [barWidth, 10],
          //   symbolOffset: [0, 0],
          //   z: 12,
          //   "color": color,
          //   "data": props.data.yAxis
          // },
          {
            name: '',
            type: 'pictorialBar',
            symbolSize: [barWidth + 10, 15],
            symbolOffset: [0, 8],
            z: 10,
            itemStyle: {
              normal: {
                color: 'transparent',
                borderColor: color,
                borderType: 'solid',
                borderWidth: 10
              }
            },
            data: props.data.yAxis
          },
          {
            name: '',
            type: 'pictorialBar',
            symbolSize: [barWidth + 20, 20],
            symbolOffset: [0, 12],
            z: 12,
            itemStyle: {
              normal: {
                color: 'transparent',
                borderColor: color,
                borderType: 'solid',
                borderWidth: 10
              }
            },
            data: props.data.yAxis,
            stack: "check",
          },
          {
            type: 'bar',
            "barWidth": barWidth,
            barGap: '10%', // Make series be overlap
            barCateGoryGap: '10%',
            itemStyle: {
              normal: {
                color: new echarts.graphic.LinearGradient(0, 0, 0, 0.7, [{
                  offset: 0,
                  color: "rgba(25,223,221,0.1)"
                },
                {
                  offset: 1,
                  color: "rgba(25,223,221,1)"
                }
                ]),
              },
            },
            data: props.data.yAxis
          },

        ]

      };
      option && chartDom.setOption(option, true);
      allData.chart = chartDom;
    };
    watch(
      () => props.refresh,
      () => {
        if (allData.chartDom) {
          allData.chartDom.dispose();
          allData.chartDom = null;
        }
        setTimeout(() => {
          init();
        }, 0);
      }
    );
    onMounted(() => {
      init();
      window.addEventListener('resize', resizeTheChart);


    });
    return {
      ...toRefs(allData),
      resizeTheChart,
      init,
    };
  },
};
</script>
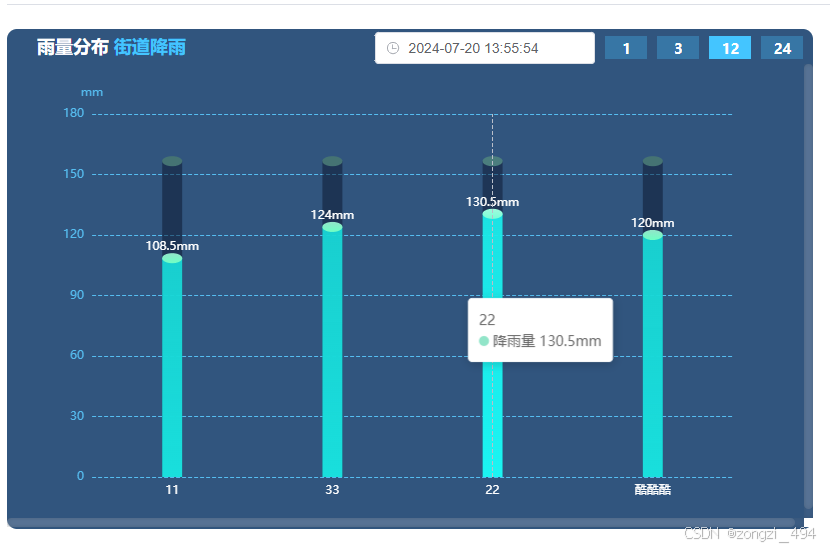
6.增加了背景阴影的柱状3D
<template>
  <div :id="id" style="width: 100%; height: 100%"></div>
</template>
<script>
import * as echarts from 'echarts';
import { guid } from '@/utils/ruoyi';
import { reactive, toRefs, onMounted, watch } from 'vue';
export default {
  name: 'line-chart',
  props: {
    data: Object,
    refresh: Number,
  },
  setup(props) {
    const allData = reactive({
      series: [],
      legend: [],
      id: guid(),
      chart: null,
    });
    const resizeTheChart = () => {
      if (allData.chart) {
        allData.chart.resize();
      }
    };

    const init = () => {
      let chartDom = echarts.init(document.getElementById(allData.id));

      var shadowYData = [100, 100];
      var color = 'rgba(31,227,249,1)';
      var barWidth = 20;

      var MaXmm = Math.max.apply(null, props.data.yAxis) * 1.2;
      var MaxArr = [];
      var sum = 0;
      if (props.data.yAxis.length) {
        for (var i = 0; i < props.data.yAxis.length; i++) {
          sum += props.data.yAxis[i];
          if (sum == 0) {
            MaxArr.push(10);
          } else {
            MaxArr.push(MaXmm);
          }
        }
      } else {
        MaxArr = [10, 10, 10, 10];
      }

      var option;
      option = {
        color: ['#5ecfff'],
        tooltip: {
          trigger: 'axis',
          // formatter: '{b}<br />{a0}: {c0}mm',
          formatter: params => {
            // console.log(params);
            var relVal = '' + params[0].name;
            for (var i = 0, l = params.length; i < l; i++) {
              if (params[i].seriesName) {
                let unit = params[i].seriesName == '降雨量' ? 'mm' : '个';
                relVal += '<br/>' + params[i].marker + params[i].seriesName + ' ' + params[i].value + unit;
              }
            }
            return relVal;
          },
        },
        grid: {
          top: 50,
          bottom: 50,
        },
        xAxis: [
          {
            type: 'category',
            axisLine: {
              show: false,
              lineStyle: {
                width: 2,
                color: '#58b2ed',
              },
            },
            splitLine: {
              show: false,
            },
            axisTick: {
              show: false,
            },
            axisLabel: {
              color: 'rgba(255,255,255,1)',
              fontSize: 12,
              fontFamily: 'AlibabaPuHuiTi',
              formatter: function (params) {
                var str = ''; // 最终拼接成的字符串
                var paramsLen = params.length; // 获取每项文字的个数
                var len = 3; // 每行能显示的字的个数(根据实际情况自己设置)
                var rowNumber = Math.ceil(paramsLen / len); // 换行的话,需要显示几行,向上取整
                if (paramsLen > len) {
                  //大于设定的len就换行,不大于就不变化
                  for (var i = 0; i < rowNumber; i++) {
                    var temp = ''; // 表示每一次截取的字符串
                    var start = i * len; // 开始截取的位置
                    var end = start + len; // 结束截取的位置
                    if (i == rowNumber - 1) {
                      // 最后一次不换行
                      temp = params.substring(start, paramsLen);
                    } else {
                      // 每一次拼接字符串并换行
                      temp = params.substring(start, end) + '\n';
                    }
                    str += temp; // 最终拼成的字符串
                  }
                } else {
                  // 给新的字符串赋值
                  str = params;
                }
                return str; //返回字符串
              },
            },
            data: props.data.xAxis,
          },
        ],
        yAxis: [
          {
            name: 'mm',
            type: 'value',
            axisLabel: {
              color: '#56bdf0',
              show: true,
            },
            nameTextStyle: {
              color: '#56bdf0',
            },
            splitLine: {
              lineStyle: {
                type: 'dashed',
                color: '#56bdf0',
              },
            },
            alignTicks: true,
          },
          // {
          //   name: '个数',
          //   type: 'value',
          //   // max: max <  ? 1 : max, // 指定最大值
          //   nameTextStyle: {
          //     color: '#FFF21C',
          //   },
          //   axisLabel: {
          //     show: true,
          //     color: '#FFF21C',
          //   },
          //   splitLine: {
          //     lineStyle: {
          //       color: '#D1DEEE',
          //       type: 'dashed',
          //       color: '#53D8FB',
          //     },
          //   },
          //   alignTicks: true,
          // },
        ],
        dataZoom: [
          {
            // show: true,
            show: false,
            height: 4,
            bottom: 18,
            start: 0,
            end: 100,
            handleSize: '100%',
            fillerColor: '#94FA41',
            borderColor: 'transparent',
            backgroundColor: 'rgba(148, 250, 65, 0.2)',
            handleStyle: {
              color: '#94FA41',
            },
            moveHandleSize: 0,
            textStyle: {
              color: '#fff',
            },
          },
          {
            type: 'inside',
            show: true,
            height: 15,
            start: 1,
            end: 35,
          },
        ],
        series: [
          // 柱状图顶部的圆片
          {
            name: '降雨量', // 系列名称, 用于tooltip的显示, legend 的图例筛选
            type: 'pictorialBar', // 系列类型
            symbolSize: [20, 10], // 标记的大小
            symbolOffset: [0, -5], // 标记相对于原本位置的偏移
            symbolPosition: 'end', // 图形的定位位置。可取值:start、end、center
            // 图例的图形样式
            itemStyle: {
              color: {
                type: 'linear',
                x: 0,
                y: 0,
                x2: 0,
                y2: 1,
                colorStops: [
                  {
                    offset: 0,
                    color: '#92e5c9', // 0% 处的颜色
                  },
                  {
                    offset: 1,
                    color: '#6effc4', // 100% 处的颜色
                  },
                ],
              },
            },
            z: 10, // 组件的所有图形的z值。控制图形的前后顺序。z值小的图形会被z值大的图形覆盖
            data: props.data.yAxis, // 系列中的数据内容数组
          },
          // 柱状图
          {
            name: '', // 系列名称, 用于tooltip的显示, legend 的图例筛选
            type: 'bar', // 系列类型
            barWidth: 20, // 指定柱宽度,可以使用绝对数值或百分比,默认自适应
            barGap: '-100%', // 不同系列的柱间距离l,如果想要两个系列的柱子重叠,可以设置 barGap 为 '-100%'。这在用柱子做背景的时候有用
            // 图例的图形样式
            itemStyle: {
              color: {
                type: 'linear',
                x: 0,
                y: 0,
                x2: 0,
                y2: 1,
                colorStops: [
                  {
                    offset: 0,
                    color: 'rgba(25,223,221,0.9)', // 0% 处的颜色
                  },
                  {
                    offset: 1,
                    color: 'rgba(25,223,221,1)', // 100% 处的颜色
                  },
                ],
              },
            },
            label: {
              show: true,
              position: 'top',
              color: '#fff',
              formatter: function (data) {
                return data.value + 'mm';
              },
            },
            data: props.data.yAxis, // 系列中的数据内容数组
          },
          // 柱状图底下的圆片
          // {
          //   name: '',
          //   type: 'pictorialBar', // 系列类型
          //   symbolSize: [20, 12], // 标记的大小
          //   symbolOffset: [0, 5], // 标记相对于原本位置的偏移
          //   // 图例的图形样式
          //   itemStyle: {
          //     color: {
          //       type: 'linear',
          //       x: 0,
          //       y: 0,
          //       x2: 0,
          //       y2: 1,
          //       colorStops: [
          //         {
          //           offset: 0,
          //           color: '#08d3bf', // 0% 处的颜色
          //         },
          //         {
          //           offset: 1,
          //           color: '#11ddd4', // 100% 处的颜色
          //         },
          //       ],
          //     },
          //   },
          //   z: 10, // 组件的所有图形的z值。控制图形的前后顺序。z值小的图形会被z值大的图形覆盖
          //   data: [1, 1, 1, 1, 1, 1, 1, 1, 1, 1, 1, 1], // 系列中的数据内容数组
          // },
          // 背景顶部的圆片
          {
            name: '', // 系列名称, 用于tooltip的显示, legend 的图例筛选
            type: 'pictorialBar', // 系列类型
            symbolSize: [20, 10], // 标记的大小
            symbolOffset: [0, -5], // 标记相对于原本位置的偏移
            symbolPosition: 'end', // 图形的定位位置。可取值:start、end、center
            // 图例的图形样式
            itemStyle: {
              color: '#457373',
              opacity: 1,
            },
            z: 10, // 组件的所有图形的z值。控制图形的前后顺序。z值小的图形会被z值大的图形覆盖
            data: MaxArr, // 系列中的数据内容数组
          },
          // 背景
          {
            name: '', // 系列名称, 用于tooltip的显示, legend 的图例筛选
            type: 'bar', // 系列类型
            barWidth: 20, // 指定柱宽度,可以使用绝对数值或百分比,默认自适应
            barGap: '-100%', // 不同系列的柱间距离l,如果想要两个系列的柱子重叠,可以设置 barGap 为 '-100%'。这在用柱子做背景的时候有用
            // 图例的图形样式
            itemStyle: {
              color: '#0a1429',
              opacity: 0.5,
            },
            z: 0, // 组件的所有图形的z值。控制图形的前后顺序。z值小的图形会被z值大的图形覆盖
            data: MaxArr, // 系列中的数据内容数组
          },
        ],
      };
      option && chartDom.setOption(option, true);
      allData.chart = chartDom;
    };
    watch(
      () => props.refresh,
      () => {
        if (allData.chartDom) {
          allData.chartDom.dispose();
          allData.chartDom = null;
        }
        setTimeout(() => {
          init();
        }, 0);
      }
    );
    onMounted(() => {
      init();
      window.addEventListener('resize', resizeTheChart);
    });
    return {
      ...toRefs(allData),
      resizeTheChart,
      init,
    };
  },
};
</script>
  <streetEcharts :data="chartData2" :refresh="chartData2.refresh" />

const chartData2 = ref({
  xAxis: [],
  yAxis: [],
  refresh: 1,
});


 2万+
2万+

 被折叠的 条评论
为什么被折叠?
被折叠的 条评论
为什么被折叠?
 到【灌水乐园】发言


