


概述
ELK是 elasticsearch + logstash + kibana 的简称。这套组合类似于MVC模型,其中logstash是controller层,数据首先传给它,它负责将数据进行过滤和格式化;elasticsearch是model层,负责数据的存储,建立搜索索引;kibana是view层,负责数据的展示。
环境
系统:centos 6.10
软件版本:tar包安装
elasticsearch-6.3.1
logstash-6.3.1
kibana-6.3.1
安装
直接tar -zxvf 解压缩即可
演示安装在/opt 下
Elasticsearch
配置
主要配置文件/etc/elasticsearch/elasticsearch.yml,修改如下内容
# Use a descriptive name for your cluster:
cluster.name: tisco_es
#bootstrap.memory_lock: true 针对低版本centos的
bootstrap.system_call_filter: false
# Set the bind address to a specific IP (IPv4 or IPv6):
network.host: 0.0.0.0
# Set a custom port for HTTP:
http.port: 9200
启动
命令目录:cd /opt/elasticsearch-6.3.1/bin/
./elasticsearch -d 后台启动
curl http://172.17.171.228:9200/
如果有类似如下的输出则是正常启动了

logstash
配置
/opt/logstash-6.3.1/ 下新建一个文件名为 logstash.conf,然后写入以下配置:

启动
安装目录下:
nohup ./bin/logstash -f ./logstash.conf &
查看启动日志:
/opt/logstash-6.3.1/logs/
查看端口:
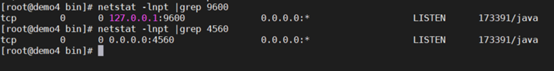
9600为程序端口,4560为监听端口
kibana
配置
文件:
/opt/kibana-6.3.1-linux-x86_64/config/ kibana.yml
修改内容:
# Kibana is served by a back end server. This setting specifies the port to use.
server.port: 5601
server.host: "0.0.0.0" #监听任意地址
# The URL of the Elasticsearch instance to use for all your queries.
elasticsearch.url: http://172.17.171.228:9200
启动
/opt/kibana-6.3.1-linux-x86_64/bin/kibana
访问网站:
http://172.17.171.228:5601

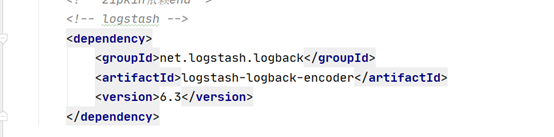
整合spring 项目
添加依赖:
logback配置文件:

演示
Kibana管理界面创建Kinaba Index Patterns:

在Index pattern里输入我们在logstash配置文件logstash.conf里output.index指定的值
logstash-*

点击Next Step,在下拉框里选择@timestamp:

最后点击Create Index Pattern按钮完成创建
在Kibana里搜索相应的logback日志:


 3054
3054


 被折叠的 条评论
为什么被折叠?
被折叠的 条评论
为什么被折叠?
 到【灌水乐园】发言


