


import numpy as np
import matplotlib.pyplot as plt
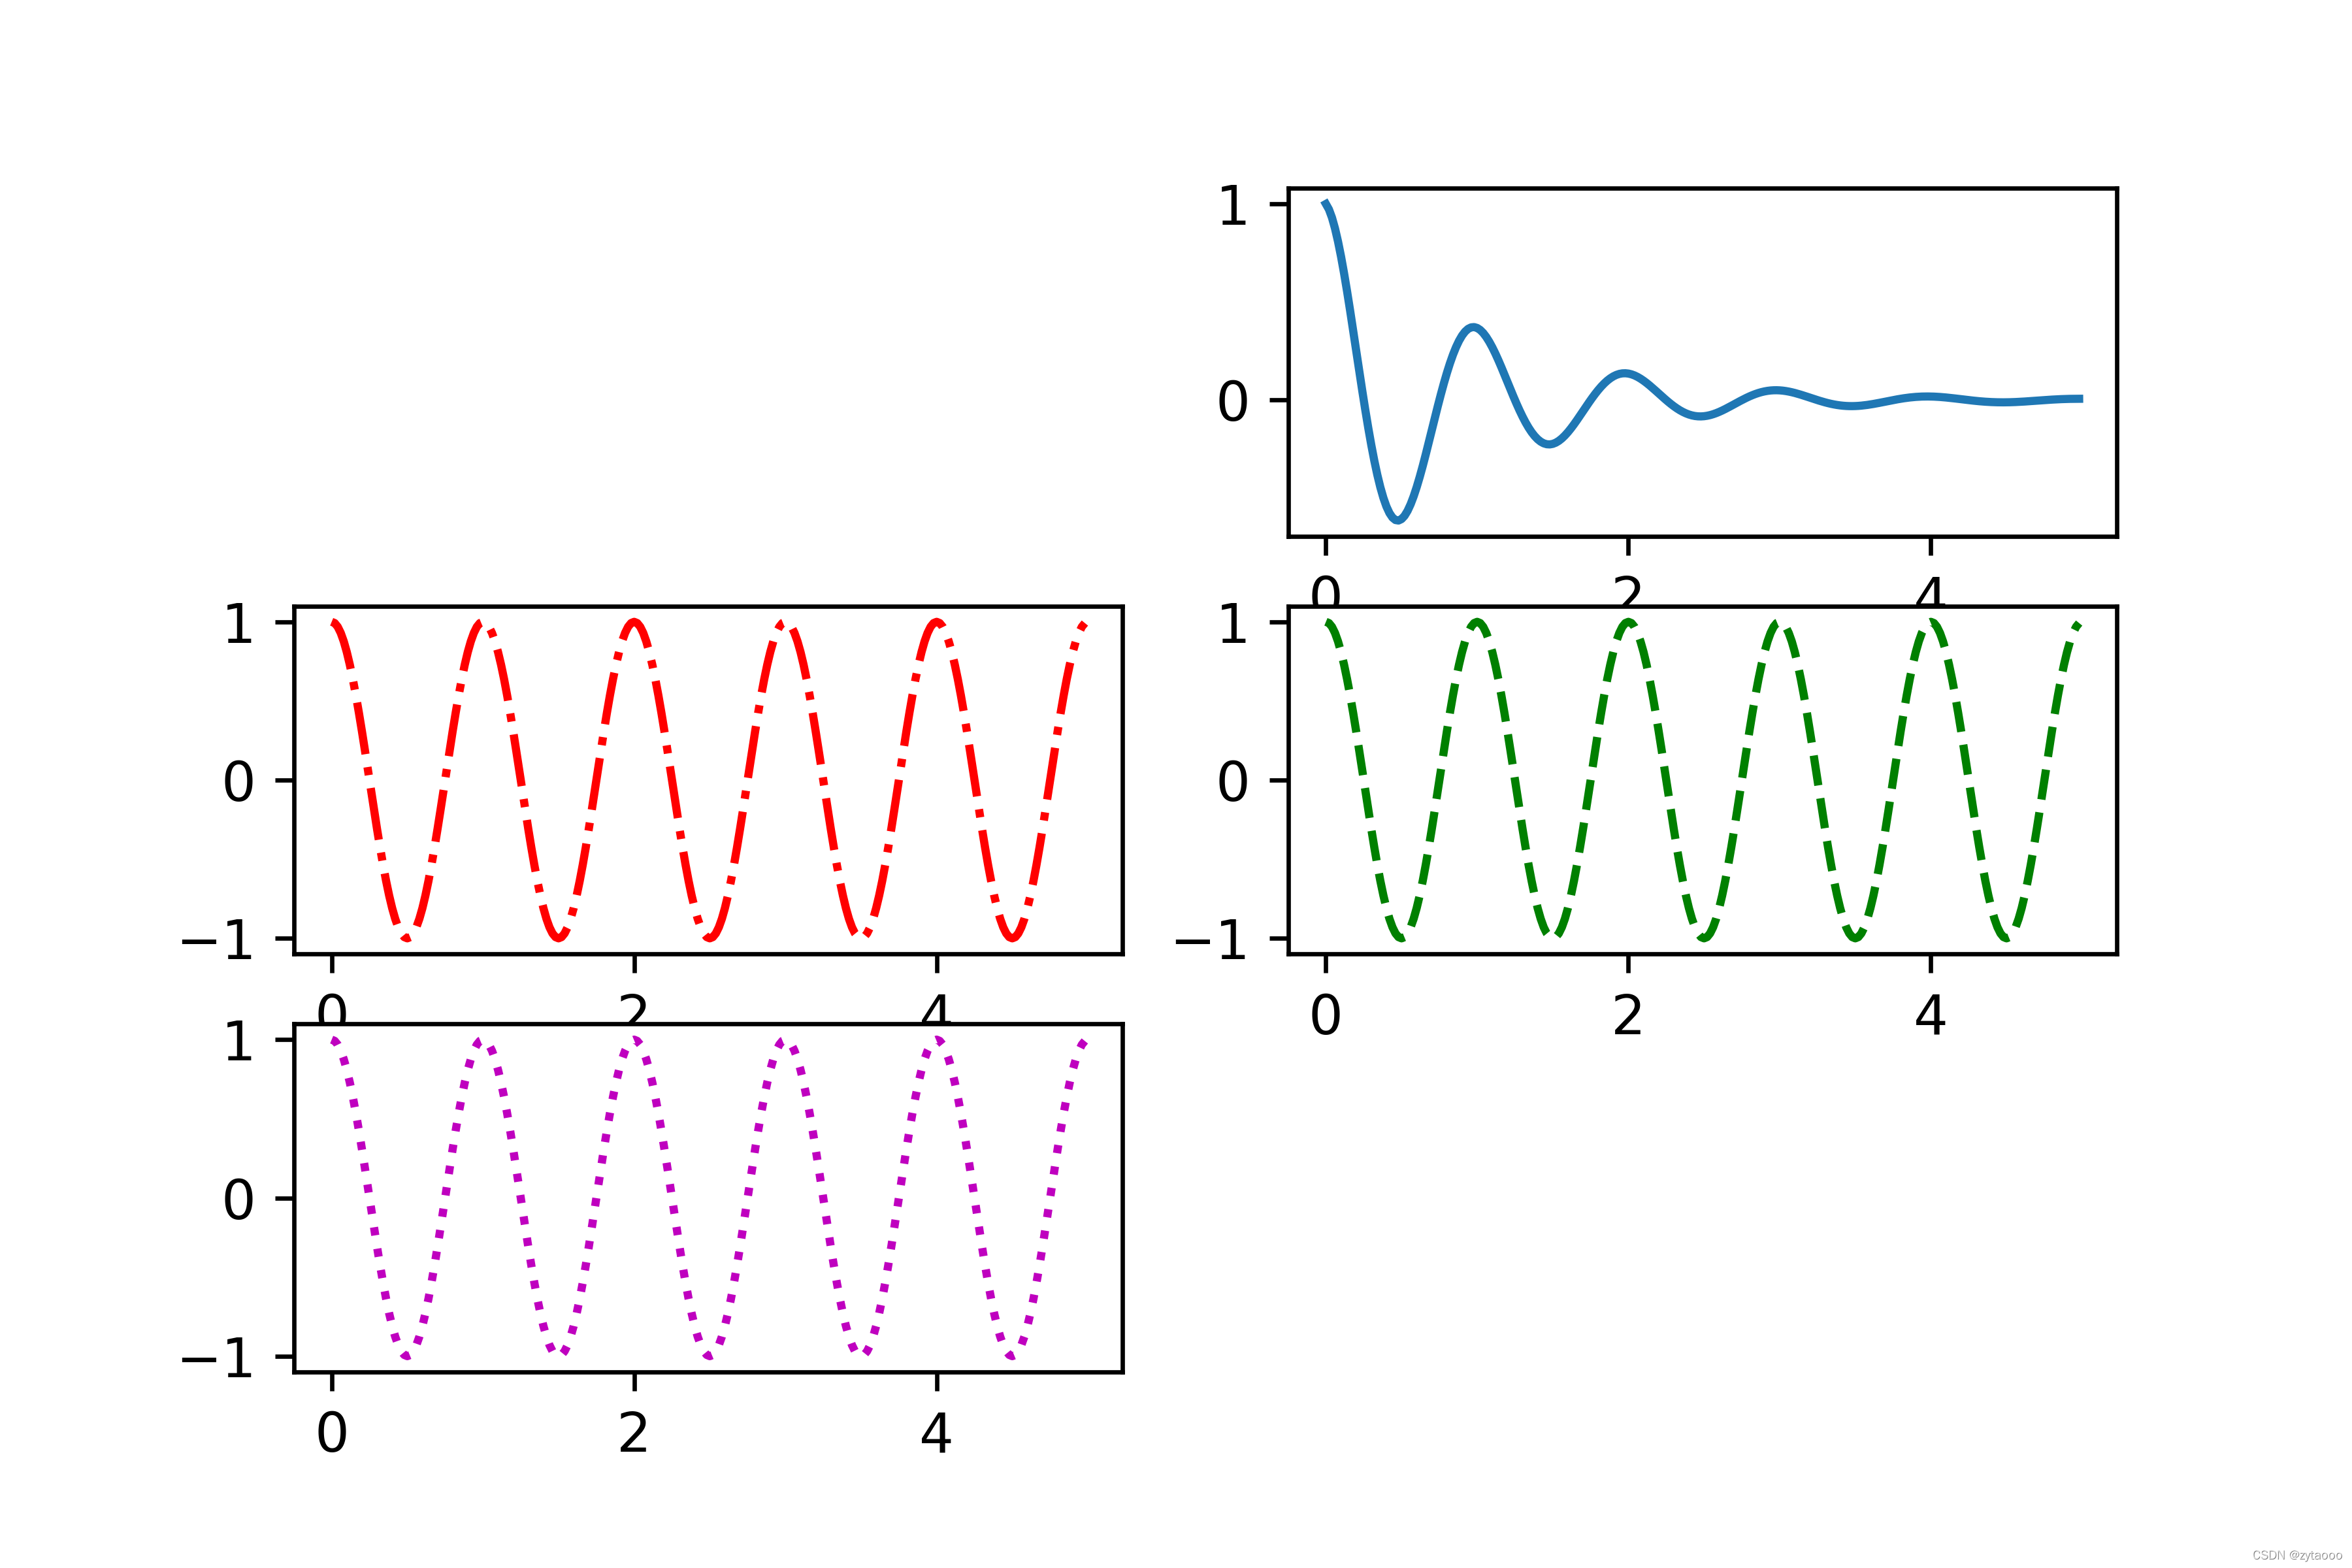
def f(t):
return np.exp(-t)*np.cos(2*np.pi*t)
a=np.arange(0,5,0.02)
plt.subplot(322)
plt.plot(a,f(a))
plt.subplot(323)
plt.plot(a,np.cos(2*np.pi*a),'-.',color='r')
plt.subplot(324)
plt.plot(a,np.cos(2*np.pi*a),'--',color='g')
plt.subplot(325)
plt.plot(a,np.cos(2*np.pi*a),':',color='m')
plt.savefig('test4',dpi=600)
plt.savefig('../picture/test4',dpi=600)
plt.show


 536
536

 被折叠的 条评论
为什么被折叠?
被折叠的 条评论
为什么被折叠?
 到【灌水乐园】发言


