


python 中常用画图工具matplotlib.pyplot工具使用实验。
代码:
from sklearn.datasets.samples_generator import make_blobs
import matplotlib.pyplot as plt
X, y = make_blobs(n_samples=100, centers=3, n_features=2,random_state=0)
y=y+1;
# label
plt.figure(1)
ax=plt.subplot(121)
plt.scatter(X[:,0],X[:,1])
ax.set_title('No lable')
ax=plt.subplot(122)
plt.scatter(X[:,0],X[:,1],y*30,y*30)
ax.set_title('Have lable')
#
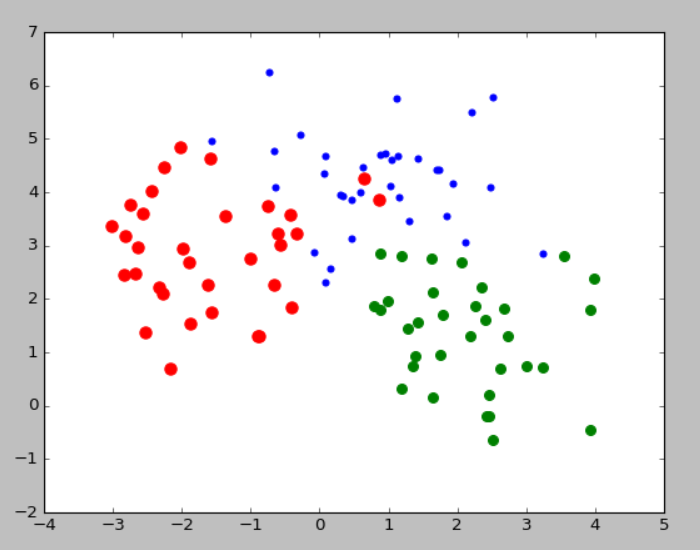
plt.figure(2)
ax=plt.subplot(111)
id=(y==1)
plt.scatter(X[id,0],X[id,1],s=20,color='b')
id=(y==2)
plt.scatter(X[id,0],X[id,1],s=50,color='r')
id=(y==3)
plt.scatter(X[id,0],X[id,1],s=70,color='g')
plt.show()显示结果:
fiugre1
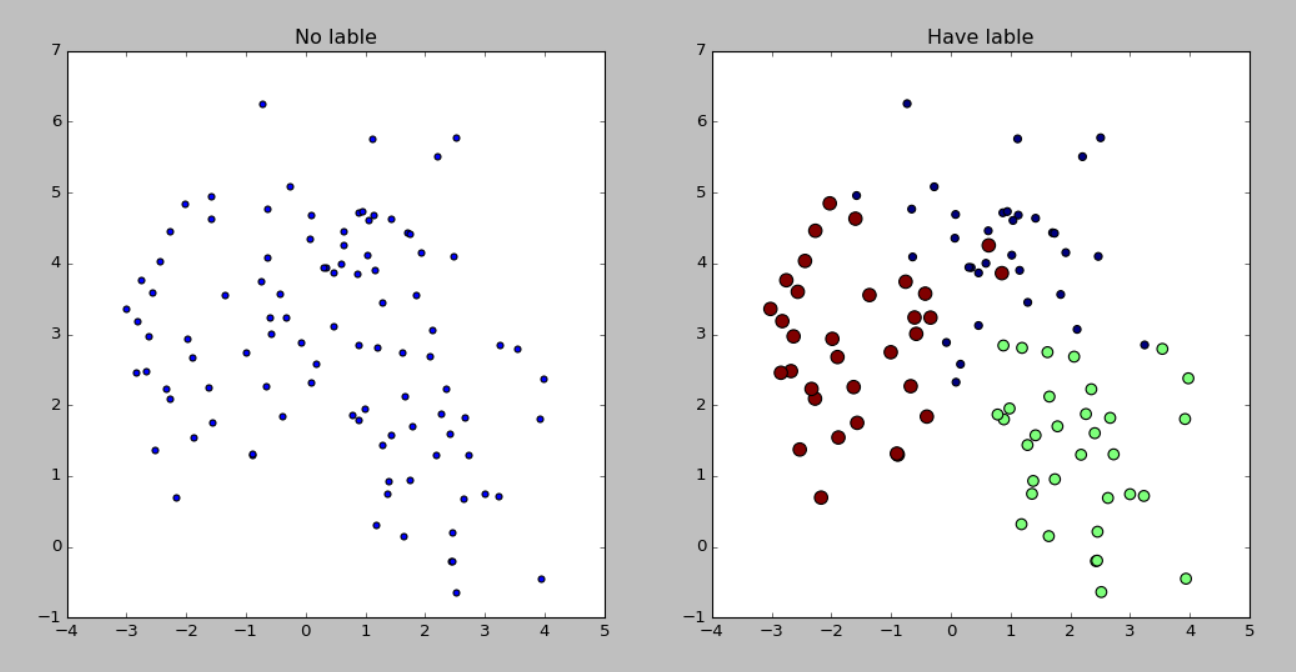
figure2


 453
453

 被折叠的 条评论
为什么被折叠?
被折叠的 条评论
为什么被折叠?
 到【灌水乐园】发言


