


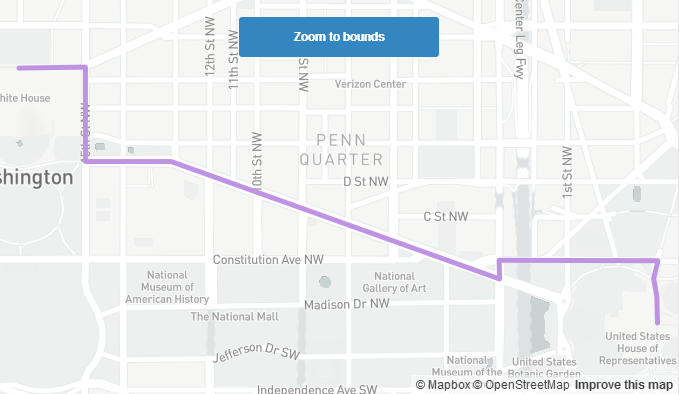
将LineString对象的第一个坐标传递给mapboxgl.LngLatBounds,然后连接extend包含最后一个坐标来获取它的边界
<!DOCTYPE html>
<html>
<head>
    <meta charset='utf-8' />
    <title></title>
    <meta name='viewport' content='initial-scale=1,maximum-scale=1,user-scalable=no' />
    <script src='https://api.tiles.mapbox.com/mapbox-gl-js/v0.29.0/mapbox-gl.js'></script>
    <link href='https://api.tiles.mapbox.com/mapbox-gl-js/v0.29.0/mapbox-gl.css' rel='stylesheet' />
    <style>
        body { margin:0; padding:0; }
        #map { position:absolute; top:0; bottom:0; width:100%; }
    </style>
</head>
<body>

<style>
.btn-control {
    font:bold 12px/20px 'Helvetica Neue', Arial, Helvetica, sans-serif;
    background-color: #3386c0;
    color: #fff;
    position: absolute;
    top: 20px;
    left: 50%;
    z-index: 1;
    border: none;
    width: 200px;
    margin-left:-100px;
    display: block;
    cursor: pointer;
    padding: 10px 20px;
    border-radius: 3px;
}

.btn-control:hover {
    background-color: #4ea0da;
}
</style>
<div id='map'></div>
<button id='zoomto' class='btn-control'>Zoom to bounds</nav>

<script>
mapboxgl.accessToken = '<your access token here>';
// A GeoJSON object with a LineString route from the White House to Capitol Hill
var geojson = {
    "type": "FeatureCollection",
    "features": [{
        "type": "Feature",
        "geometry": {
            "type": "LineString",   /* LineString类型的形状 */
            "properties": {},
            "coordinates": [
                [-77.0366048812866, 38.89873175227713],
                [-77.03364372253417, 38.89876515143842],
                [-77.03364372253417, 38.89549195896866],
                [-77.02982425689697, 38.89549195896866],
                [-77.02400922775269, 38.89387200688839],
                [-77.01519012451172, 38.891416957534204],
                [-77.01521158218382, 38.892068305429156],
                [-77.00813055038452, 38.892051604275686],
                [-77.00832366943358, 38.89143365883688],
                [-77.00818419456482, 38.89082405874451],
                [-77.00815200805664, 38.88989712255097]
            ]
        }
    }]
};

var map = new mapboxgl.Map({
    container: 'map',
    style: 'mapbox://styles/mapbox/light-v9',
    center: [-77.0214, 38.8970],
    zoom: 12
});

map.on('load', function() {
    // Add a GeoJSON source containing place coordinates and information.
    map.addSource("LineString", {
        "type": "geojson",
        "data": geojson
    });

    map.addLayer({
        "id": "LineString",
        "type": "line",
        "source": "LineString",
        "layout": {
            "line-join": "round",   /* 线条相交处的样式 */
            "line-cap": "round"     /* 线条末端的样式 */
        },
        "paint": {
            "line-color": "#BF93E4", /* 线条颜色 */
            "line-width": 5          /* 线条宽度 */
        }
    });

    document.getElementById('zoomto').addEventListener('click', function() { /* 为zoomto元素添加click事件 */

        // Geographic coordinates of the LineString
        var coordinates = geojson.features[0].geometry.coordinates;

        // Pass the first coordinates in the LineString to `lngLatBounds` &
        // wrap each coordinate pair in `extend` to include them in the bounds
        // result. A variation of this technique could be applied to zooming
        // to the bounds of multiple Points or Polygon geomteries - it just
        // requires wrapping all the coordinates with the extend method.
        var bounds = coordinates.reduce(function(bounds, coord) {  /* reduce语法:array1.reduce(callbackfn[, initialValue])  callbackfn语法:function callbackfn(previousValue, currentValue, currentIndex, array1),这里整个语句的含义是以坐标0为初始值,边界逐渐扩展边界到最后一个坐标 */
            return bounds.extend(coord);   /* extend  (obj):包含给定的经纬度或者经纬度边界来扩展区域边界 */
        }, new mapboxgl.LngLatBounds(coordinates[0], coordinates[0])); /*new LngLatBounds(sw: [LngLatLike], ne: [LngLatLike]):创建LngLatBounds的构造器,LngLatBounds对象表示一个地理上有界限的区域,使用西南和东北的点的经纬坐标表示  */

        map.fitBounds(bounds, {  /*fitBounds(bounds,[options],[eventData]):移动缩放地图来将某个可视化区域包含在指定的地理边界内部,最终也会使用最高的zoomlevel来显示可视化区域试图  */
            padding: 20
        });
    });
});
</script>

</body>
</html>原文:https://www.mapbox.com/mapbox-gl-js/example/zoomto-linestring/


 1335
1335

 被折叠的 条评论
为什么被折叠?
被折叠的 条评论
为什么被折叠?
 到【灌水乐园】发言


